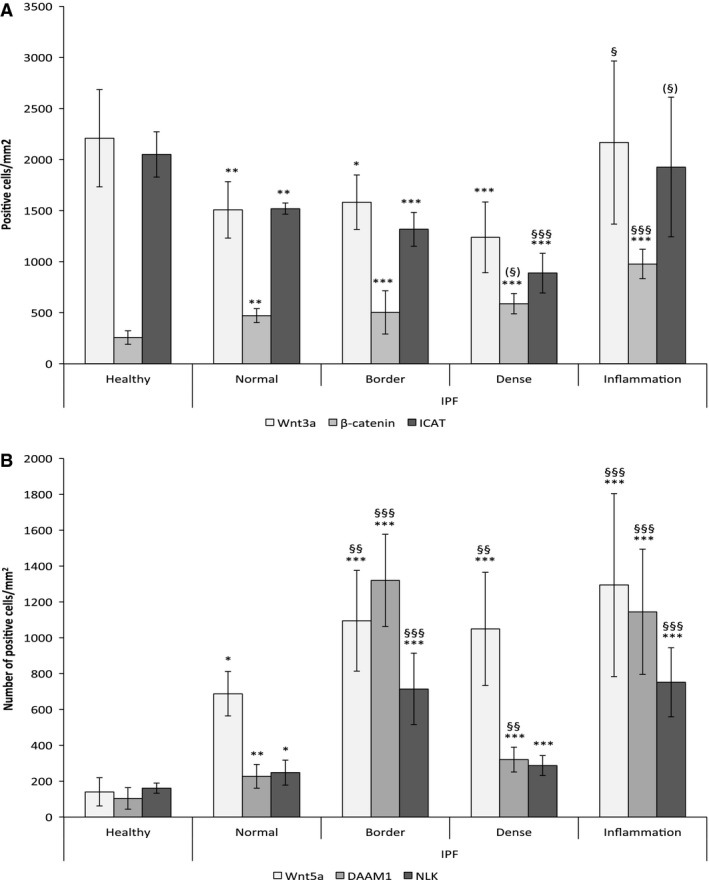
Figure 3.

Expression of β‐catenin, ICAT, Wnt3a, DAAM1, NLK and Wnt5a, and representative illustrations of tissue labeling. Expression of Wnt3a, β‐catenin, and ICAT in healthy lungs, and in different regions of fibrotic lung (A). In densely fibrotic and border zones n =10 and in healthy lungs n = 6 for all parameters. Normal‐looking parenchyma n = 6 (β ‐catenin, ICAT) or 7 (Wnt3a); Inflammation n = 8 (β ‐catenin), n = 9 (Wnt3a), and n = 10 (ICAT). Expression of Wnt5a, DAAM1, NLK and in healthy lungs, as well as in different regions of fibrotic lung (B). For densely fibrotic areas n = 10 and in healthy lungs n = 6 for all parameters. Normal‐looking parenchyma n = 8 (DAAM1), n = 6 (NLK, Wnt5a); Border zone n = 6 (DAAM1, Wnt5a), n = 7 (NLK, Wnt5a); n = 6 (NLK); Inflammation n = 8 (DAAM1, Wnt5a), n = 7 (NLK). The variation in inflammatory areas is massive, likely due to very individual inflammatory pattern. *Denotes difference compared to healthy lungs, and § denotes difference compared to normal‐looking areas of IPF lungs. (§) Marks strong tendency P = 0.05–0.07.
