Figure 1.

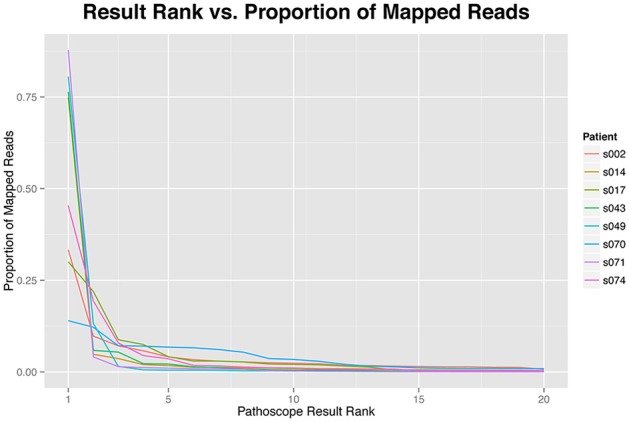
The proportion of reads mapping to each identified taxonomic unit by results rank. The proportion of reads are highly skewed toward the top hits, more than 75% of the reads of each sample are represented by the first five results.

The proportion of reads mapping to each identified taxonomic unit by results rank. The proportion of reads are highly skewed toward the top hits, more than 75% of the reads of each sample are represented by the first five results.