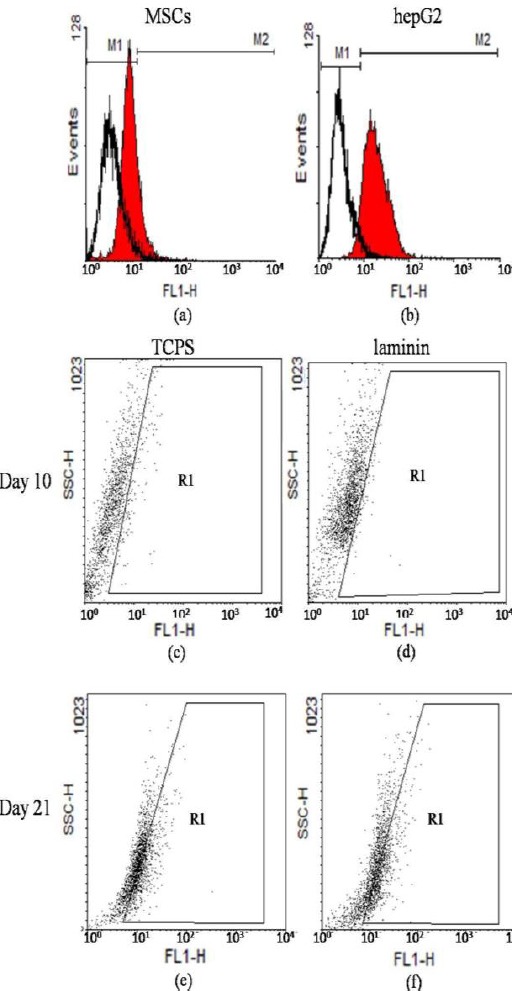
Figure 6.

Flowcytometric analysis of C-MET expression with WinMDI 2.8 software. C-MET expression in human bMSCs (day 0) (12.39%) (panel a), hepG2 (93.35%) (panel b), 10th day of differentiation in cells on polystyrene (3.5%) (panel c) and on laminin (3.8%) (panel d), and 21th day of differentiation in cells on polystyrene (34.6%) (panel e) and on laminin (36.20%) (panel f)
