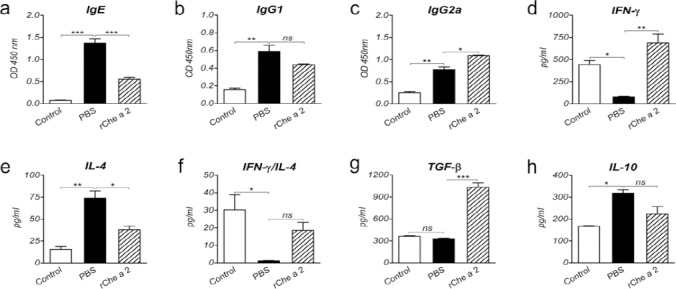
Figure 1.

Systemic responses after sublingual immunotherapy. a-c, Specific IgE (a), IgG1 (b), and IgG2a (c) serum levels in control (non-sensitized), PBS-treated (sham treated), and rChe a 2-treated groups. d-h, IFN-γ (d), IL-4 (e), TGF-β (g), and IL-10 (h) levels and IFN-γ/IL-4 (f) in the supernatants of splenocytes stimulated with rChe a 2 from the respective groups. Bars indicate the average OD of antibody levels or cytokine concentrations in pg/ml ± SEM. ns, not significant. * P<0.05, ** P<0.01, and ***P<0.001
