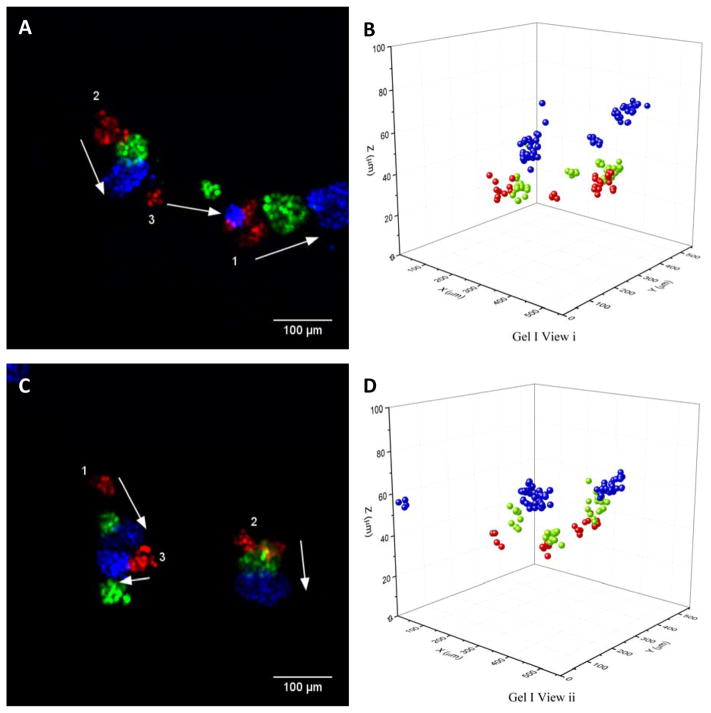
Figure 1.
Panels A and C show Z-projections of 2 fields of view from the same 3D collagen gel with MDCK GFP-NLS cell cohorts at 0 h (red), 24 h (green) and 48 h (blue). The numbers in white indicate cohort number as determined by a clustering algorithm. Panels B and D are 3D renderings of nuclear tracking corresponding to Panel A and C respectively.

