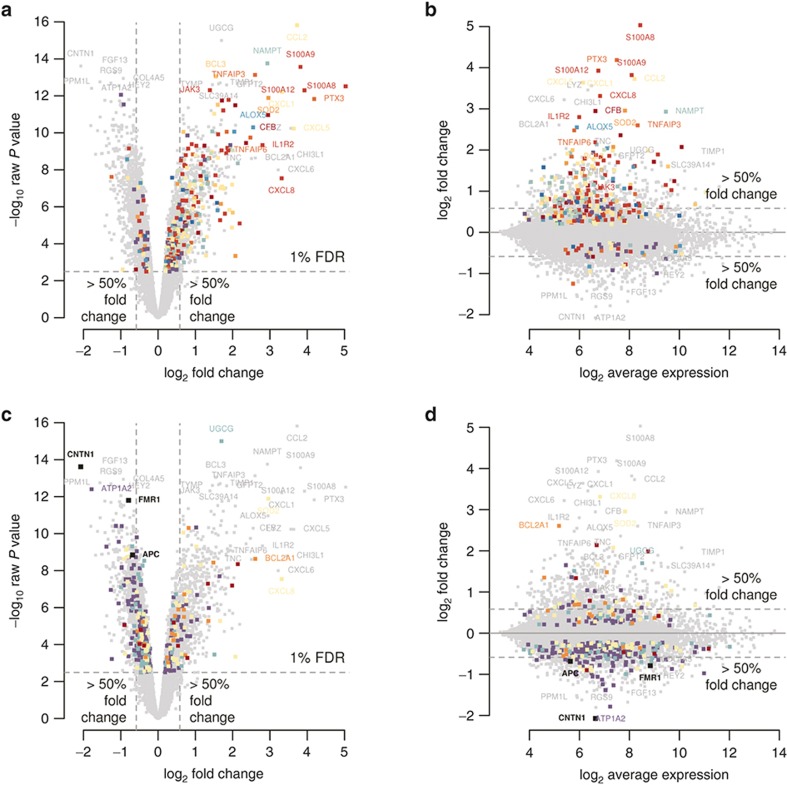
Figure 1.
Differential gene expression caused by FIR. (a,c) Volcano plot of the significance level of gene expression changes between FIR and non-FIR infants in −log10 scale (y-axis), as function of their fold-change (x-axis) in log2 scale. The horizontal dashed line indicates the threshold for a multiple-test correction above which 3,896 genes change significantly their expression at FDR < 1%. Vertical dashed lines indicate a minimum magnitude of 1.5-fold change in expression, met by 1,097 genes with FDR < 1%. Genes highlighted in colors enrich significantly the following gene sets: (a) Complement cascase (carmine), Cytokine signaling (dark red), TNF superfamily signaling (red), reactive oxygen species/glutathione/cytotoxic granules (salmon), Th17 cell response (orange), Adhesion/extravasation/migration (yellow), NF-kB signaling (yellow–green), innate pathogen detection (light green), leukocyte signaling (green), eicosanoid signaling (turquoise), phagocytosis/Ag presentation (blue), MAPK signaling (violet); (c) MSC genes (carmine), apoptosis genes (salmon), senescence genes (yellow), APC targets (green), FMRP targets (violet). (b,d) MA-plot of the magnitude of gene expression changes (y-axis) as function of the average expression (x-axis), both in log2 scale. Horizontal dashed lines indicate a minimum magnitude of 1.5-fold change in expression. Colors highlight the same gene sets as in a and c.

