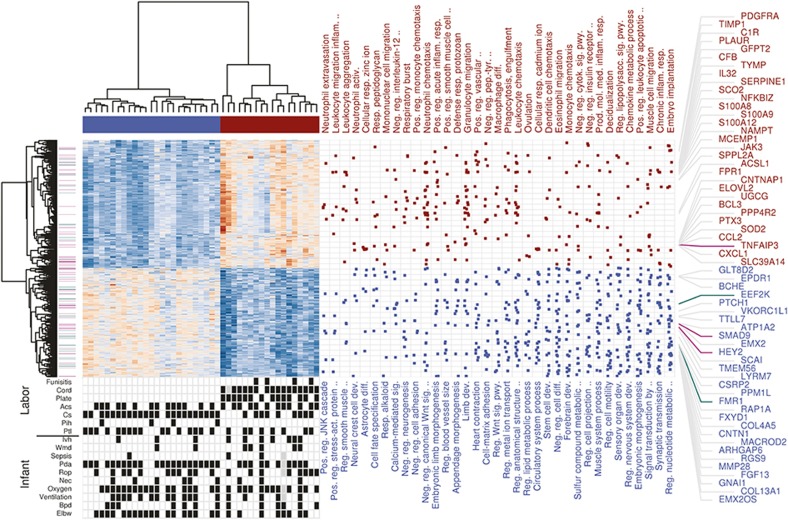
Figure 2.
Functional enrichment analysis of the FIR expression signature. Heatmap of expression values for 1,097 DE genes with FDR < 1% and minimum 1.5-fold change between FIR and non-FIR infants, obtained after removing FIR-unrelated variability. Dendrograms on the x and y-axes represent the hierarchical clustering of samples and genes, respectively. Leaves on the gene dendrogram are color coded according to whether genes encode for transcription factors (violet) or RNA-binding proteins (green), while those on the sample dendrogram are color coded according to FIR status where red indicates samples derived from FIR-affected infants and blue unaffected ones. The right dot-matrix represents DE genes (y-axis) belonging to GO terms (x-axis) significantly enriched (FDR < 10% and OR > 1.5) by upregulated (top) and downregulated (bottom) DE genes. Only the top-35 GO terms with highest OR from left to right are reported. The top 60 DE genes with largest fold change are on the right-hand side. At the bottom left, a dot-matrix representation of infant phenotypes is provided including Ivh, Wmd, Pda, Rop, Nec, Oxygen (>27 d of oxygen), ventilation (>7 d of ventilation), Bpd, Elbw (weight < 1,000 g), and labor conditions including cord (neutrophils in UC), plate (neutrophils in chorionic plate), Acs, Cs, Pih, and Ptl.

