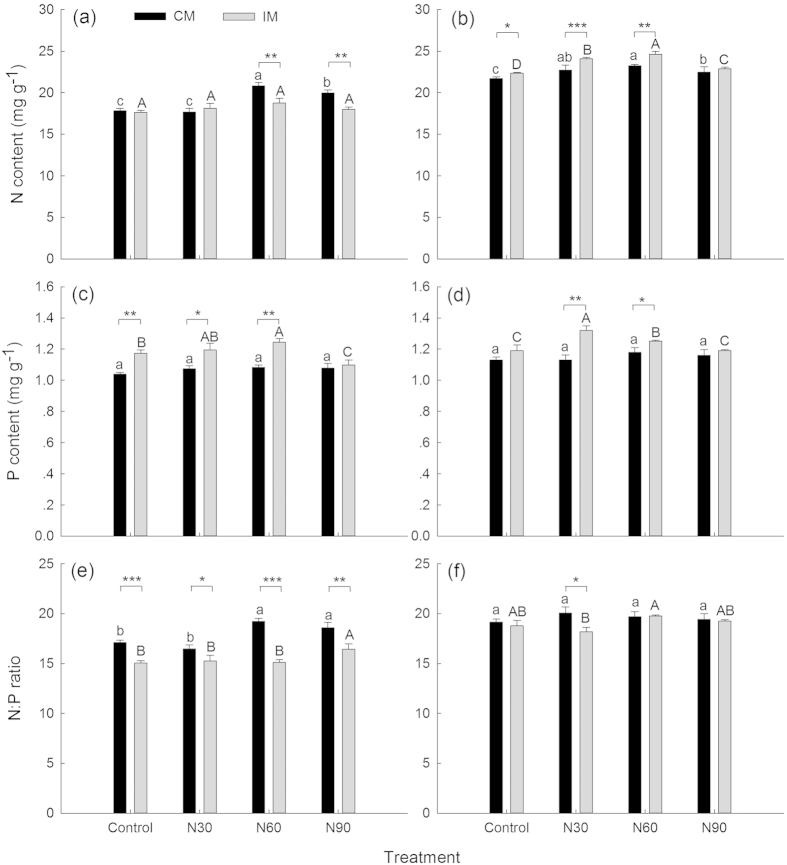
Figure 1.
Mature Moso bamboo foliar N (a) and P (c) concentrations and the N:P ratio (e), and young Moso bamboo foliar N (b), and P (d) concentrations and the N:P ratio (f) under different management practices (CM: conventional management; IM: intensive management) and N treatments (control; N30: 30 kg N ha−1yr−1; N60: 60 kg N ha−1yr−1; N90: 90 kg N ha−1yr−1) (n = 3). Different lowercase letters indicate significant differences among N addition rates under CM treatments (P < 0.05). Different capital letters indicate significant differences among N addition rates under IM treatments (P < 0.05). Asterisks indicate significant differences between CM and IM at the same N addition rate (*P < 0.05, **P < 0.01, ***P < 0.001).

