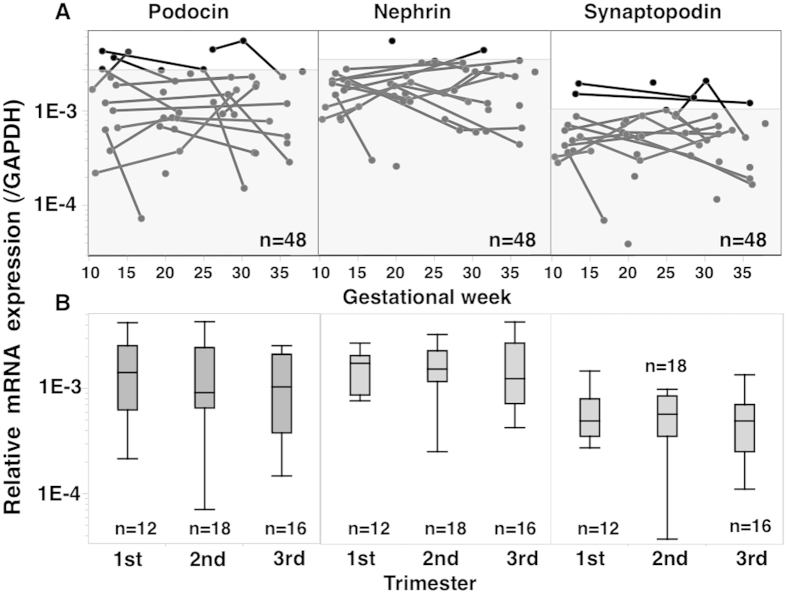
Figure 1. Changes in Pod-, Nep-, and Syn-mRNA expression levels in normtensive control pregnancies.
In this analysis, only urine specimens showing detectable levels of all three mRNAs were used (n = 48). However, the 90th percentile mRNA level was obtained using all 77 urine specimens from 38 normotensive control women on the assumption that in 29 specimens with at least one undetectable mRNA, all three mRNA expression levels were less than in 48 specimens with detectable levels of all three mRNAs. The shaded area in A indicates mRNA level <90th percentile. (B) Changes in mRNA expression according to pregnancy trimester. Only one datum with the highest value was used for women with multiple urine samples available within the same pregnancy trimester. No significant changes in mRNA expression occurred during pregnancy in control women.

