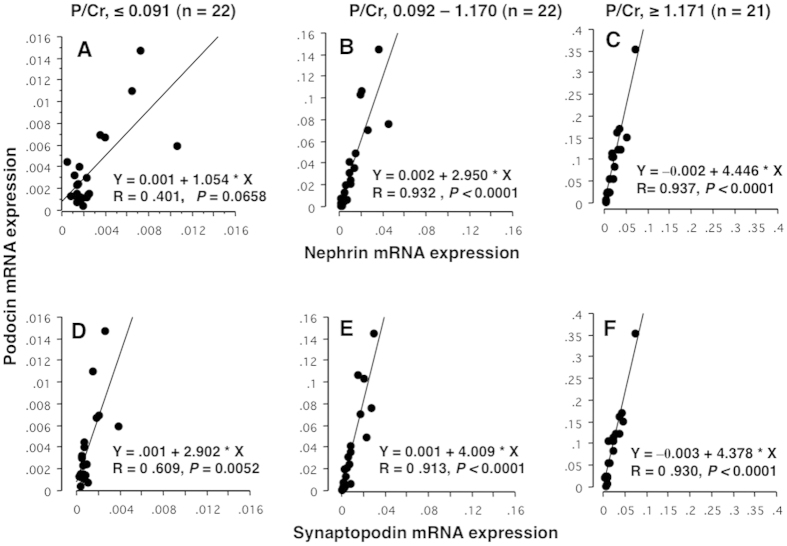
Figure 5. Association of Pod-mRNA expression with those of Nep- and Syn-mRNA in tertile groups by P/Cr level.
Urine specimens were the same as those in Figs 3 and 4. Sixty-five antenatal urine samples from PE women were divided into tertile groups according to P/Cr (A,D, 1st tertile group with P/Cr level ≤0.091; B,E, 2nd tertile group with P/Cr level 0.092–1.170; and C and F, 3rd tertile group with P/Cr level ≥1.171). (A–C) Correlations of Pod-mRNA against Nep-mRNA; (D–F, correlations of Pod-mRNA against Syn-mRNA. The changes in slope of linear regression equation according to P/Cr levels were of interest: 1.054, 2.950, and 4.446 for correlations between Pod-mRNA and Nep-mRNA of the 1st, 2nd, and 3rd P/Cr tertile groups, respectively, and 2.902, 4.009, and 4.378 for correlations between Pod-mRNA and Syn-mRNA of the 1st, 2nd, and 3rd P/Cr tertile groups, respectively. The degree of increase in correlation coefficient according to P/Cr was more marked for Pod-mRNA against Nep-mRNA than against Syn-mRNA. The correlation was very strong (R value >0.9) even between Pod-mRNA and Syn-mRNA for the 2nd and 3rd P/Cr tertile groups, suggesting that Syn-mRNA also derived from podocytes.

