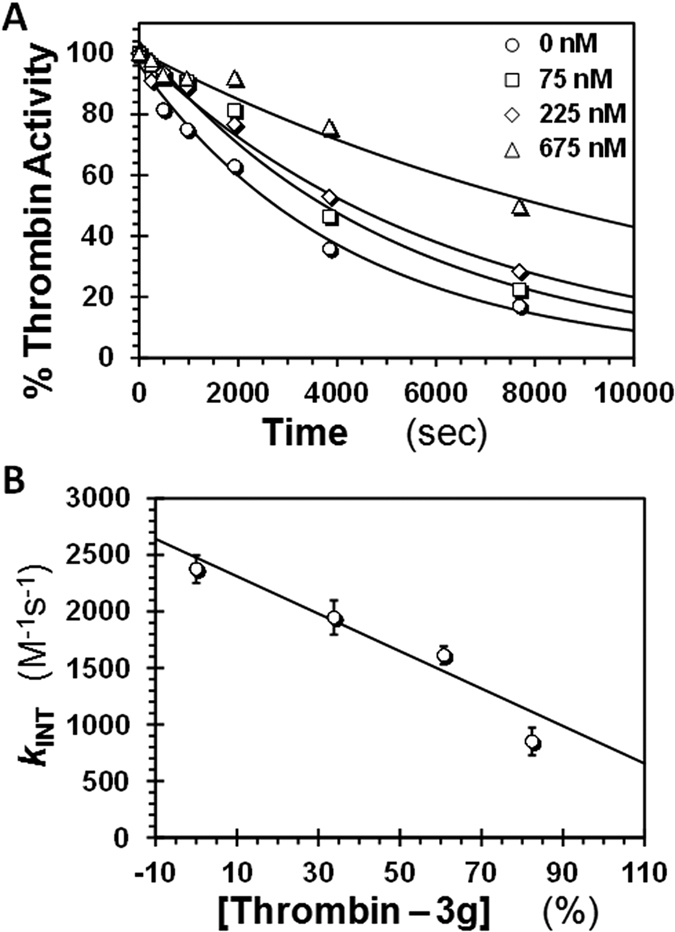
Figure 6. Structural changes induced in the active site of thrombin by 3g.

(A) Residual thrombin activity as a function of time following incubation with excess antithrombin in the presence of fixed concentrations of 3g (0–675 nM) in pH 7.2 buffer at 25 °C. Solid lines represent exponential fits to the data using equation 6 to calculate the pseudo first order rate constant kOBS. (B) Dependence of intrinsic second order rate constant of thrombin–antithrombin reaction (kINT), calculated from kOBS (above) using equation 7, as a function of the percent saturation of thrombin at different levels of 3g (i.e., [thrombin–3g]/[thrombin]). Solid line represents linear fit to the data to obtain the kINT for thrombin–3g complex at pH 7.2 and 25 °C.
