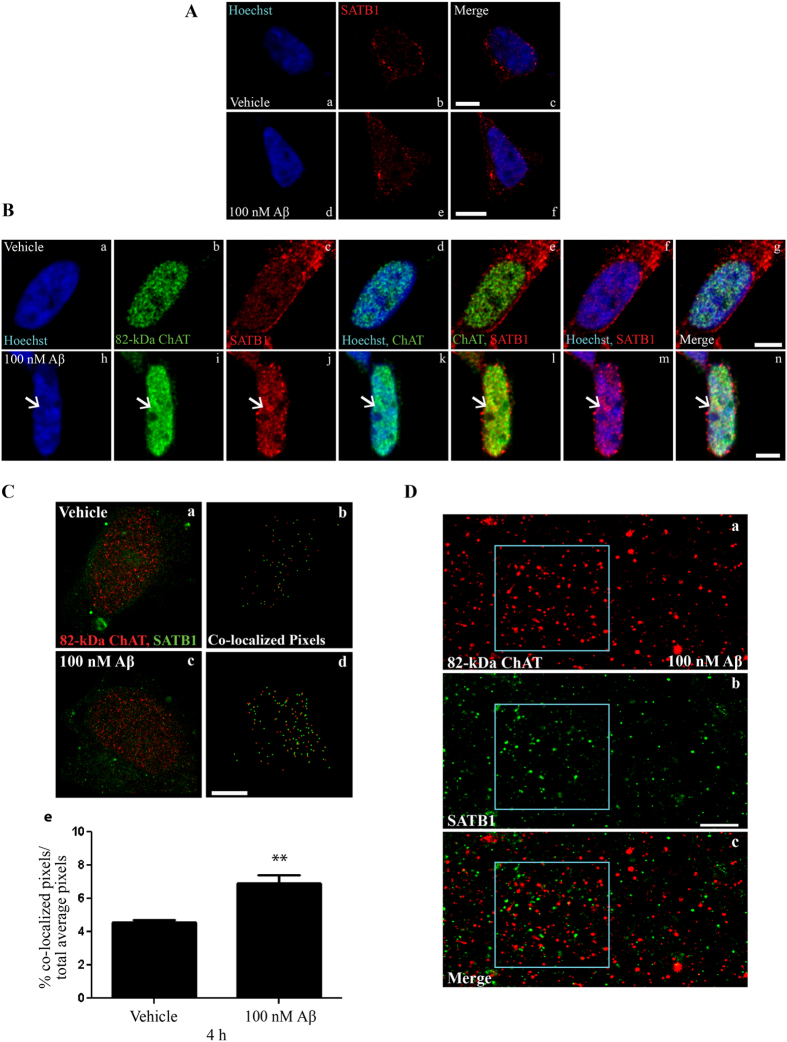
Figure 3. Aβ-induced 82-kDa ChAT aggregates are co-localized with SATB1.
(A) SH-SY5Y cells expressing empty vector were treated with either vehicle (a–c) or 100 nM oligomeric Aβ1–42 (d–f) for 4 h. SATB1 was localized to nucleus and cytoplasm, with diffuse expression in nucleus in both vehicle and Aβ-treated cells. The left panel shows Hoechst staining, center panel shows SATB1 immunostaining, and right panel is the overlay. (B) SH-SY5Y cells stably expressing 82-kDa ChAT treated with vehicle (a–g) or 100 nM oligomeric Aβ1–42 (h–n) for 4 h. After treatment with Aβ, 82-kDa ChAT (i) showed nuclear aggregates (arrows). SATB1 nuclear expression was greater than in control cells and showed aggregate formation (j) in the same region as the 82-kDa ChAT aggregates (l). Scale bar 5 μm; n = 5, with at least 6 cells imaged per treatment. (C) Co-localization analysis for SR-GSDIM images of 82-kDa ChAT and SATB1. (b) and (d) are the co-localization results for the respective SR-GSDIM image of vehicle (a) and 100 nM Aβ1–42 (c) treatments. (e) The percentage of co-localized pixels was increased significantly in Aβ-treated cells. **p < 0.01 (Student’s t-test, n = 5). (D) Digitally magnified SR-GSDIM images for 82-kDa ChAT (a) and SATB1 (b) levels after 100 nM oligomeric Aβ1–42 for 4 h. The boxed region shows an Aβ-induced aggregate of 82-kDa ChAT and SATB1. The overlay (c) revealed SATB1 protein within the 82-kDa ChAT accumulation. Scale bar 500 nm; n = 6, with at least 4 cells imaged per treatment.

