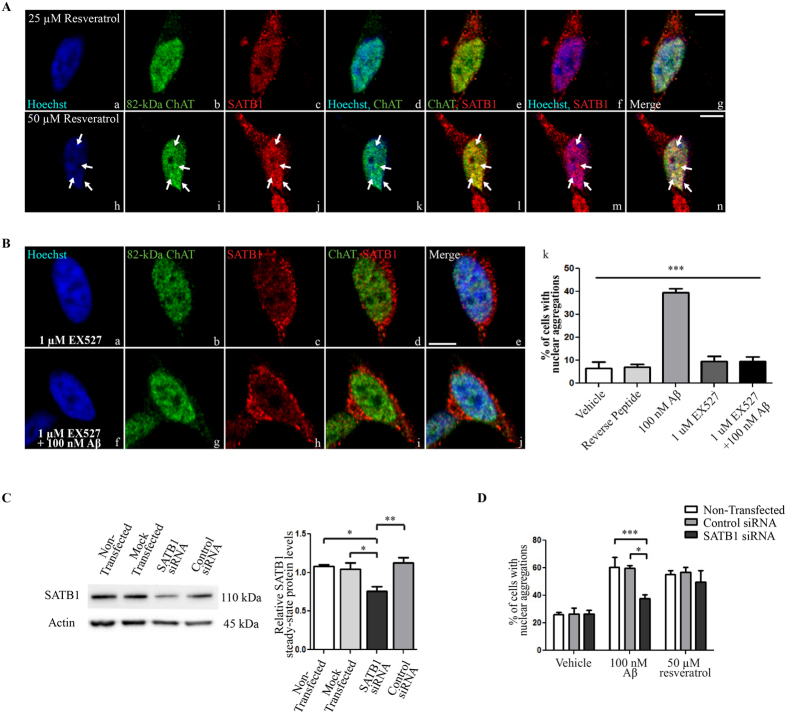
Figure 4. Activation of SIRT1 is required for 82-kDa ChAT/SATB1 aggregate formation.
(A) SH-SY5Y cells stably expressing 82-kDa ChAT and treated with the SIRT1 activator resveratrol at 25 μM for 5 h (a–g) did not result in formation of aggregates of either 82-kDa ChAT or SATB1 proteins. Treatment with 50 μM resveratrol promoted aggregate formation (arrows on h–n) of both 82-kDa ChAT (i) and SATB1 (j) proteins that were co-localized (l,n). Scale bar 5 μm; n = 5 with at least 5 cells imaged for each treatment. (B) Cells were pre-treated with the SIRT1 inhibitor EX527 for 1 h prior to 4 h treatment with vehicle (a–e) or 100 nM oligomeric Aβ1–42 (f–j). Pre-treatment of cells with EX527 prior to Aβ-exposure prevented the formation of 82-kDa ChAT aggregates (k). n = 5, ***p < 0.001 (one-way ANOVA). (C) Representative western immunoblot showing SATB1 steady-state protein levels in SH-SY5Y cells stably expressing 82-kDa ChAT and either non-transfected, mock transfected with no siRNA, transfected with untargeted control siRNA, or transfected with siRNA targeted to SATB1 for 24 h. Quantification revealed a 29% reduction in SATB1 protein expression compared to controls. n = 5, **p < 0.01, *p < 0.05 (one-way ANOVA with Tukey’s post hoc test). (D) SH-SY5Y cells stably expressing 82-kDa ChAT were either non-transfected, transfected with untargeted control siRNA, or transfected with siRNA targeted to SATB1 for 24 h, followed by either 100 nM oligomeric Aβ1–42 for 4 h or 50 μM resveratrol for 5 h. The number of cells positive for nuclear aggregates of 82-kDa ChAT were quantified by a blinded observer as a percentage of the total number of cells counted. After Aβ1–42 -exposure, the percentage of 82-kDa ChAT aggregates were significantly reduced after SATB1 siRNA knockdown compared to non-transfected or control siRNA transfected cells. We observed no significant differences for resveratrol or vehicle treatment. n = 3 independent experiments with at least 100 cells counted per treatment group, ***p < 0.001, *p < 0.05 (two-way ANOVA with Bonferroni’s post hoc test).

