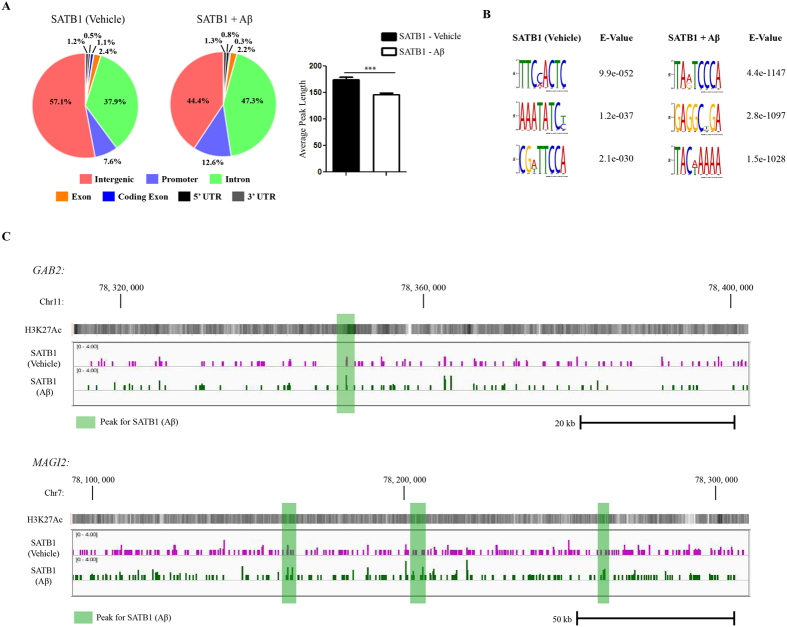
Figure 5. SATB1 has altered genome association after exposure of cells to Aβ.
(A) ChIP-seq analysis was performed for SATB1 using SH-SY5Y cells stably expressing 82-kDa ChAT and exposed to either vehicle or 100 nM oligomeric Aβ1–42. Genomic features identified for SATB1. Aβ treatment increases SATB1 association with introns and promoters. Treatment with Aβ1–42, significantly decreased average peak length for SATB1. ***p < 0.001 (Student’s t-test). (B) The top DREME motif hits for SATB1 after vehicle or Aβ1–42 -exposure revealed a TC2-3AT motif, and a known SATB1 binding motif. (C) Example ChIP-seq tracks for SATB1 after vehicle or Aβ1–42 -exposure of cells for regions of GAB2 and MAGI2 genes corresponding to the same regions in Fig. 2C. Peaks are highlighted in green for Aβ1–42 peaks. There were no vehicle related peaks in these regions (see Fig. S2 for examples). H3K27Ac is overlaid to show active transcription initiation sites.

