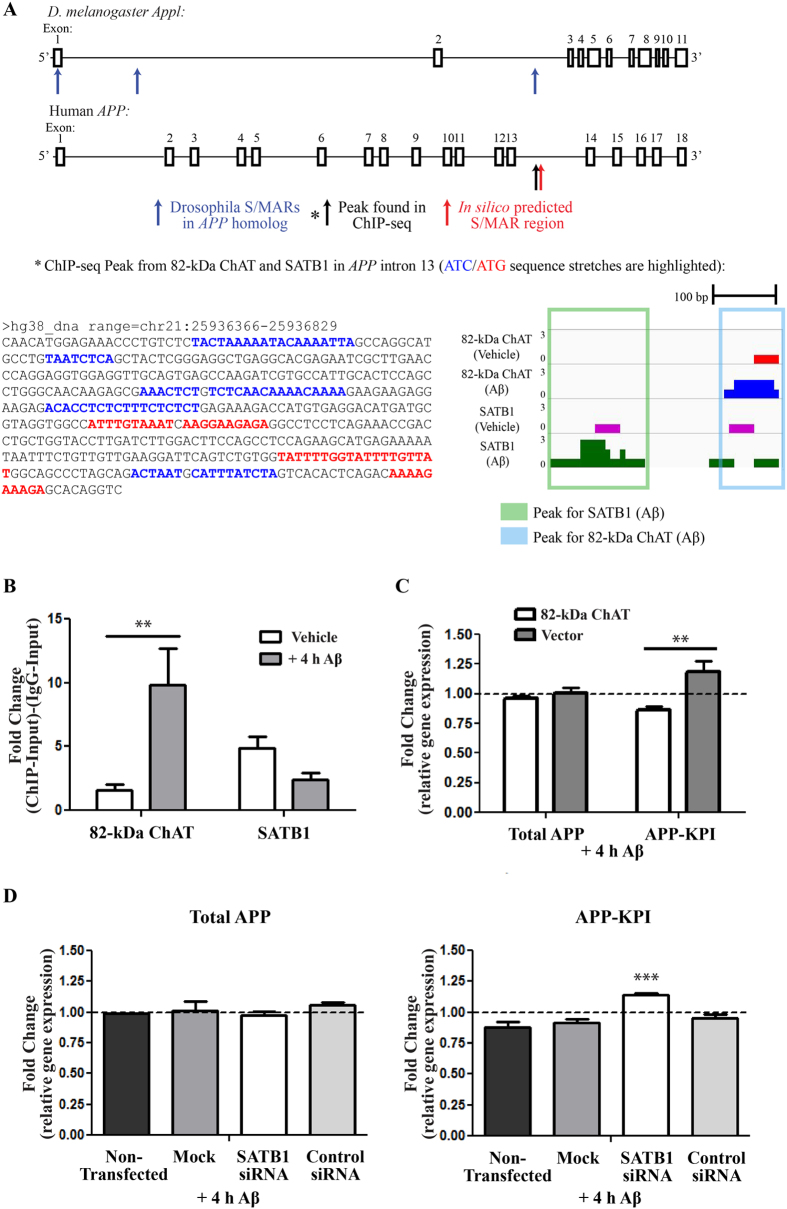
Figure 7. 82-kDa ChAT and SATB1 associate with the APP gene after Aβ-exposure and alter gene expression.
(A) Schematic showing exons (boxes) and introns (horizontal lines) for the D. melanogaster Appl and human APP genes. Blue arrows indicate S/MARs regions on Appl identified by Pathak et al.37, the red arrow a predicted S/MAR in APP by in silico analysis, and the black arrow a ChIP-seq peak found for 82-kDa ChAT and SATB1 after Aβ1–42 -exposure. ATC/ATG rich sequences are highlighted in this region. ChIP-seq tracks for 82-kDa ChAT and SATB1 are also shown for this region. (B) Verification of 82-kDa ChAT and SATB1 ChIP-seq peaks on APP. 82-kDa ChAT showed significantly increased fold-enrichment after exposure of cells to 100 nM oligomeric Aβ1–42 for 4 h, while SATB1 did not significantly change its association with the region after either vehicle or Aβ1–42 treatment. n = 6, **p < 0.01 (two-way ANOVA with Bonferroni’s post-hoc test). (C) APP steady-state mRNA expression in 82-kDa ChAT or vector-expressing cells after exposure to 100 nM oligomeric Aβ1–42. Data are presented as fold-enrichment compared to reference (GAPDH) mRNA levels and vehicle-treated cells (dashed-line). Vector-expressing cells showed higher steady-state mRNA levels of isoforms containing KPI compared to 82-kDa ChAT-expressing cells. n = 4, **p < 0.01 (two-way ANOVA with Bonferroni’s post-hoc test). (D) APP steady-state mRNA expression in 82-kDa ChAT-expressing cells after exposure to 100 nM oligomeric Aβ1–42 after either no transfection, a mock transfection, transfection with untargeted control siRNA, or transfection with siRNA targeted to SATB1. Data are presented as fold-enrichment compared to reference (GAPDH) mRNA levels and vehicle-treated cells (dashed-line). There were no significant changes in total APP mRNA levels for any of the treatments. Cells transfected with SATB1 siRNA showed higher steady-state mRNA levels of APP isoforms containing KPI compared to non-transfected 82-kDa ChAT-expressing cells. n = 5, ***p < 0.001 (one-way ANOVA with Dunnett’s post-hoc test).

