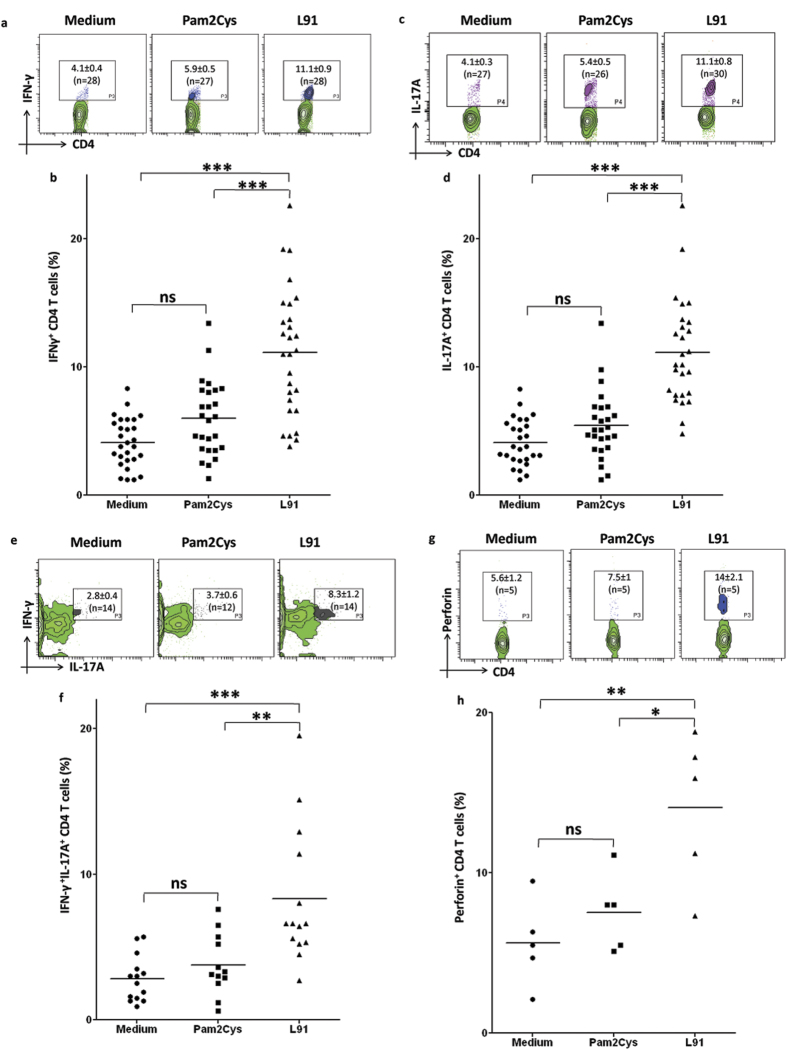
Figure 6. Drug treatment of TB patients does not hamper the efficacy of L91 in the activation of the generation of Th1 and Th17 immunity and memory CD4 T cells.
PBMCs of TB patients were cultured with L91 and controls with Pam2Cys and medium for 96 h. Later, CD4+ T cells were analyzed for the expression of IFN-γ, IL-17A and perforin. The contour plots of flowcytometery and scatter dot plots represent the percent population of (a,b) IFN-γ (n = 28), (c,d) IL-17A (n = 27), (e,f) co-expression of IFN-γ and IL-17A (n = 14), (g,h) perforin (n = 5) expressing CD4 T cells. Data depicted as contour and dot plot are percent population of cells. Each dot corresponds to one patient. The data depicted as means ± SEM. *P ≤ 0.05, **P ≤ 0.005, ***P ≤ 0.0005, ns = none significant.

