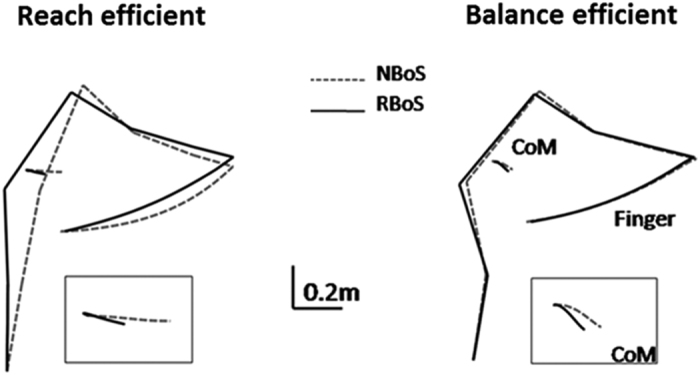
Figure 7. Effect of reduced base of support on simulated movements.

Mean final angular configurations and CoM and finger trajectories produced by the minimization of the two selected cost functions, reach efficient (left) and balance efficient (right), in RBoS (black lines) and NBoS (dotted gray lines) conditions. Boxes at the lower right show the corresponding CoM trajectories (enlarged).
