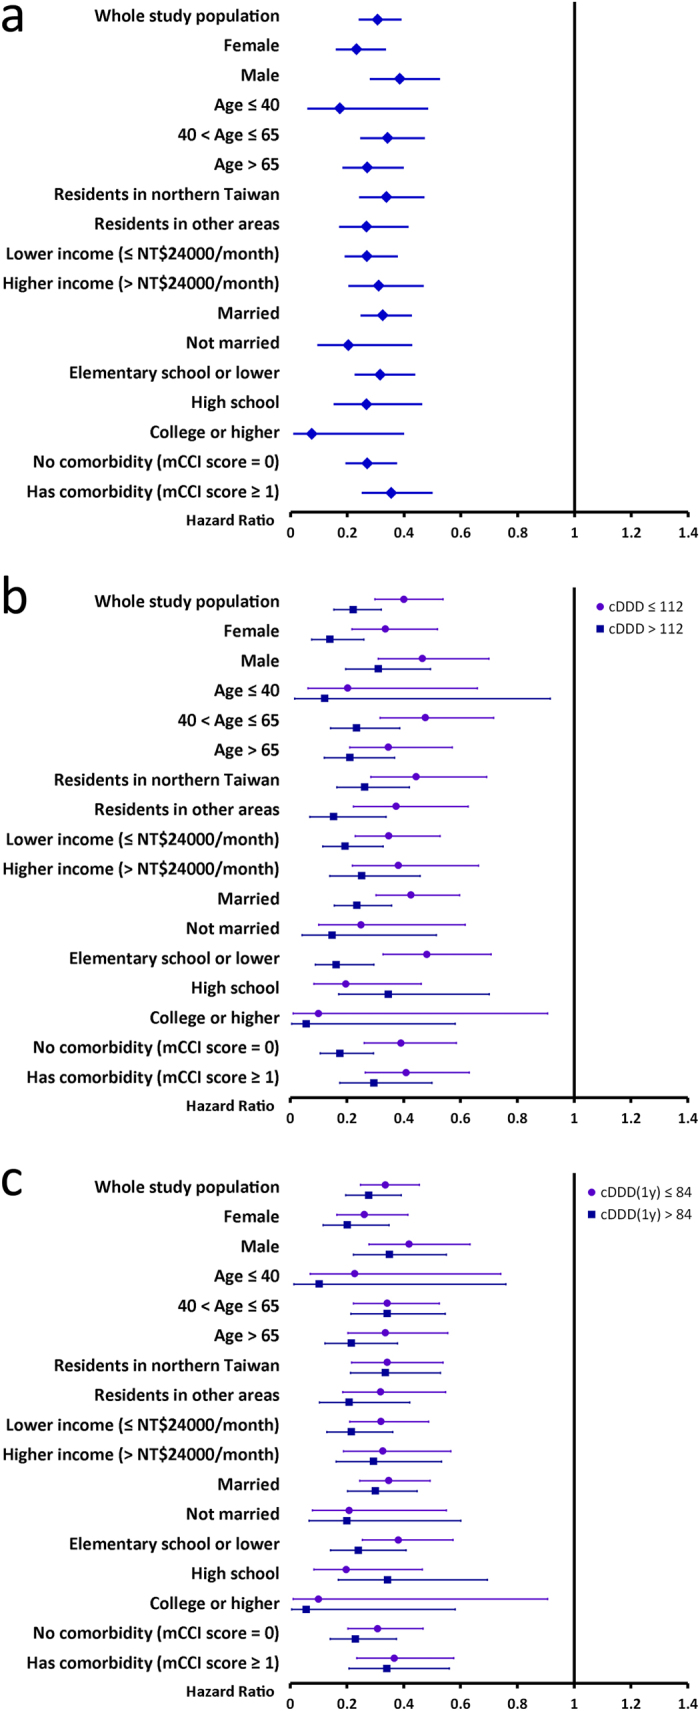
Figure 3.

Stratified analyses of the multivariable Cox proportional hazards regression analyses showing adjusted hazard ratios (HRs) of (a) LTRA use and (b,c) lower and higher doses of LTRA use. The results are presented with adjusted HRs (95% confidence interval) of either (a) LTRA use or (b,c) lower and higher doses of LTRA use, which are adjusted for age, residency, income level, marriage status, education level and the presence of various comorbidities (except for the variable used for stratification). The follow-up time was calculated from a year after the index date to either development of cancer, death or the end of 2011, whichever came first. The cumulative defined daily doses of LTRA were calculated from the index date to the end of follow-up (cDDD) and to a year after the index date [cDDD(1y)].
