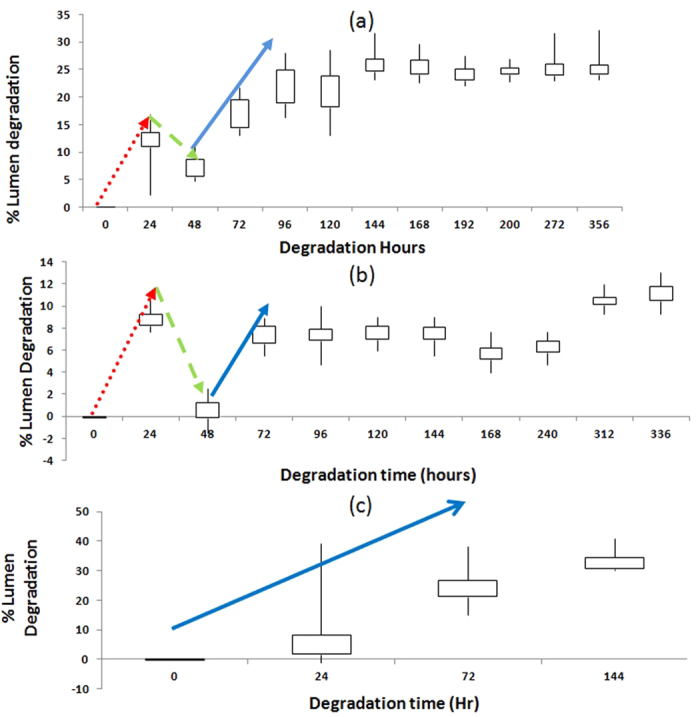
Figure 1. Percentage lumen degradation vs test time for blue and white LEDs tested under different operating conditions.

(a) Blue LEDs under power-on condition; (b) Blue LEDs under power-off condition; and (c) White LEDs under power-on condition. Red line (dotted line) denotes the initial degradation; green line (dash line) indicates the lumen recovery and the blue line (solid line) indicates the final degradation for the LEDs.
