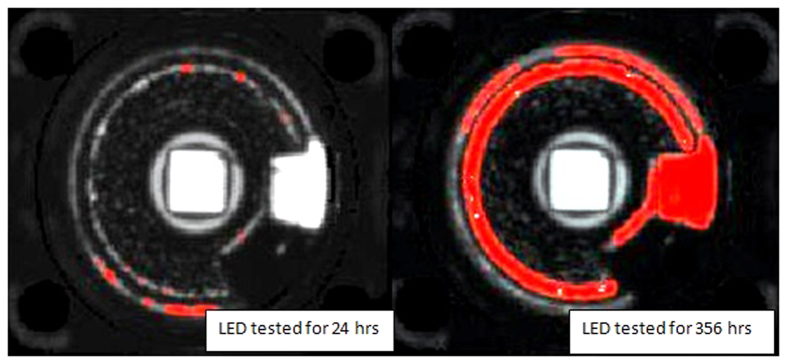
Figure 11. C-SAM images for comparison of Blue LEDs before and after recovery stage.
The red areas show where the cracks/delamination occurs when the samples are exposed to high temperature and humidity exposures. The left side image shows the blue LED’s C-SAM image tested for 24 hours and right side image is the degraded blue LED’s C-SAM image tested for 356 hours. The die attach area can be identified easily by a square exactly at the center of the LED package.

