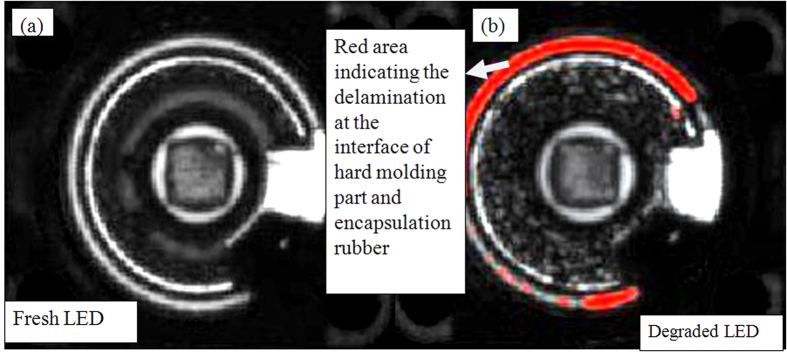
Figure 7. C-SAM images showing the delamination at interface between silicone and molding part of WHITE LEDs.
The red area show where the cracks occur when the samples are exposed to high temperature exposures. The left side image shows the fresh LED’s C-SAM image and right side image is the degraded LED’s C-SAM image (sample 1 in Table 3). The die attach area can be identified easily by a square exactly at the center of the LED package.

