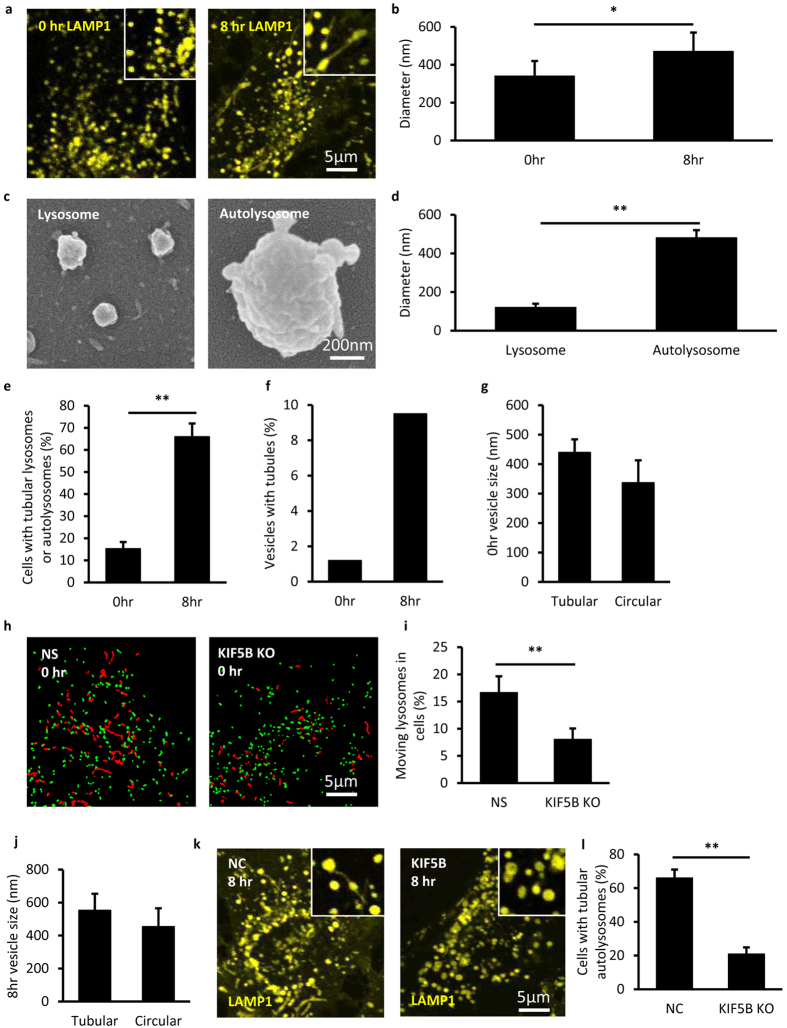
Figure 1. Size dependent lysosome motion and autolysosome tubulation driven by KIF5B in vivo.
(a) NRK cells stably expressing LAMP1-mCherry (yellow) were starved for 0 hr and 8 hr. At 0 hr all the LAMP-1 positive vesicles are relative small and circular, while at 8 hr some large and tubular vesicles appear. Scale bar, 5 μm. (b) The diameter of the vesicles at 0 hr and 8 hr was analyzed from the fluorescent images in (a). n > 300. Error bars indicate the s.d. This value, measured with optical fluorescence microscopy, is close to the resolution limited by optical diffraction and may not reflect the real sizes18. (c) Lysosomes and autolysosomes were purified from NRK cells and the quality of purified vesicles was monitored by SEM. Scale bar, 200 nm. (d) The diameter of the vesicles was analyzed from the SEM images in (c). n > 300. Error bars indicate the s.d., p < 0.01. (e) Cells from (a) were assessed for tubular lysosomes or autolysosomes and quantified. n = 100 cells from three independent experiments. Error bars indicate the s.d., p < 0.01. (f) Percentage of vesicles with tubular structure from (a) were assessed. n > 5000. (g) The diameter of the vesicles from 0 hr cells in (a) was analyzed. n > 10000 lysosomes. Error bars indicate the s.d. (h) Lysosomes in NRK cells were labeled with LysoTracker and tracked on a Spinning Disk Confocal Microscope. The lysosomes whose moving distance is longer than 1 μm (red trajectories) and the lysosomes whose moving range less than 1 μm (green dots) were tracked in normal NRK cells and KIF5B KO cells. Scale bar, 5 μm. (i) The percentage of moving lysosomes in cells from (k) were determined. n > 5000 lysosomes from three independent experiments. Error bars indicate the s.d., p < 0.01. (j) The diameter of the vesicles from 8 hr cells in (a) was analyzed. n > 5000 autolysosomes. Error bars indicate the s.d. (k) NRK cells stably expressing LAMP1-mCherry were transfected with nonspecific (NS)-RNAi or KIF5B-RNAi and starved for 8 hr. Scale bar, 5 μm. (l) Cells from (i) were assessed for tubular autolysosomes after starvation and quantified. n = 100 cells from three independent experiments. Error bars indicate the s.d., p < 0.01.

