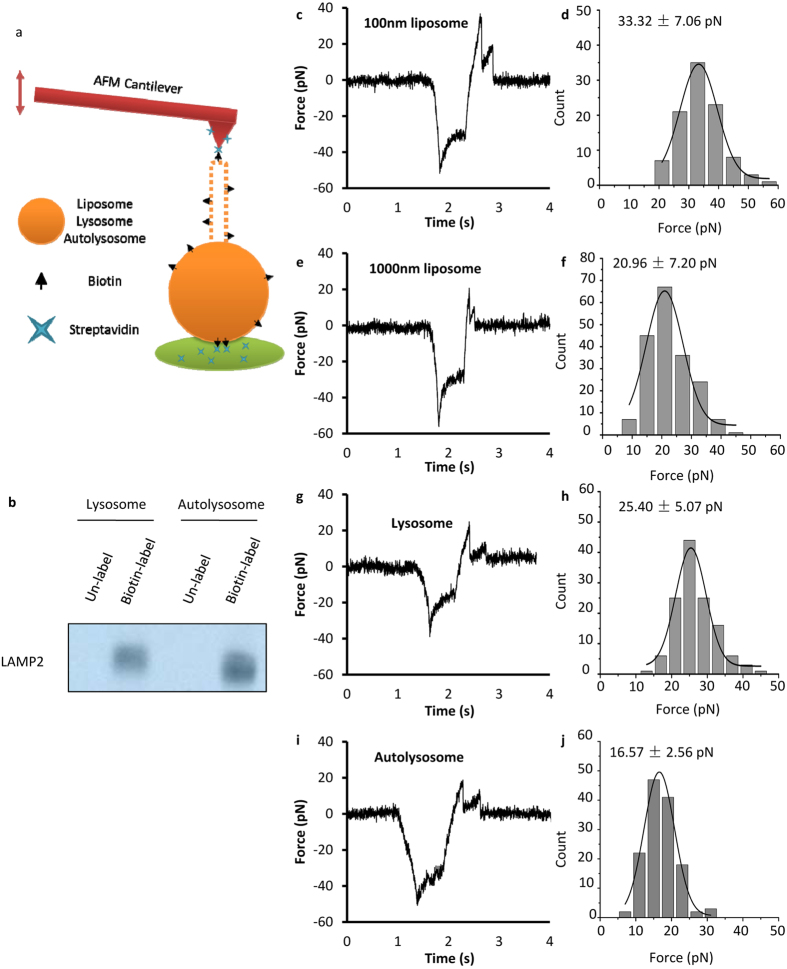
Figure 4. AFM force spectroscopy test on liposomes, lysosomes and autolysosomes.
(a) Schematic diagram of AFM spectroscopy test on biotin labeled vesicles. The brain polar lipid mixture was supplemented with 20% PE-biotin and 1% PE-rhodamine B, and the solution was extruded through 100 nm and 1000 nm pore polycarbonate filter to generate different size liposomes. The lysosomes and autolysosomes were labeled with NHS conjugated Biotin. (b) Labeled lysosomes and autolysosomes were crosslinked with streptavidin beads and detected by western blot towards LAMP2. (c,d) Force (pN) vs time (s) curve and histogram of the first peak (pN) for 100 nm liposomes. (e,f) Force (pN) vs time (s) curve and histogram of the first peak (pN) for 1000 nm liposomes. (g,h) Force (pN) vs time (s) curve and histogram of the first peak (pN) for lysosomes. (i,j) Force (pN) vs time (s) curve and histogram of the first peak (pN) for autolysosomes.

