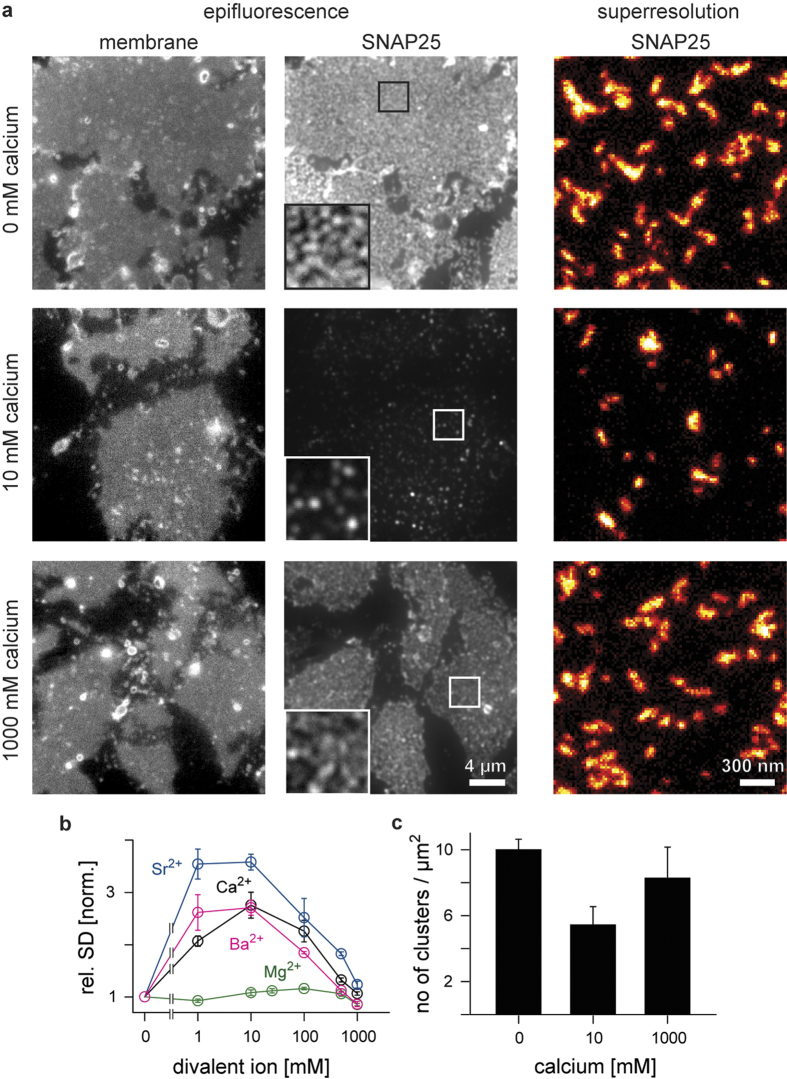
Figure 1. SNAP25 in native plasma membrane sheets shows biphasic clustering in response to divalent ions.
PC12 plasma membrane sheets incubated at 37 °C for 10 min with the indicated concentrations of calcium, strontium, barium or magnesium chloride, fixed, immunostained for SNAP25 and analysed with epifluorescence or superresolution STED microscopy. (a) Membrane sheets incubated with 0, 10, or 1000 mM CaCl2. Epifluorescence recordings from the dye TMA-DPH (left; documenting the integrity of the membranes) and the immunostaining (middle; overviews are shown at the same, magnified insets at arbitrary scaling). Right, STED micrographs of SNAP25 immunofluorescence to which the “red hot” look up table was applied which displays increasingly brighter pixel intensities applying a colour code from black to red to yellow to white. (b) SNAP25 clustering was quantified by calculating the relative standard deviation (rel. SD) of the immunostaining pattern, normalized to the baseline condition which contained no divalent cations. Values are means ± s.e.m. (c) SNAP25 cluster density (means ± s.e.m.) resolved by superresolution STED microscopy. Cluster size was similar under all conditions (Supplementary Fig. 4).

