
Figure 3. Quantification of tumour heterogeneity by ISHProfiler.
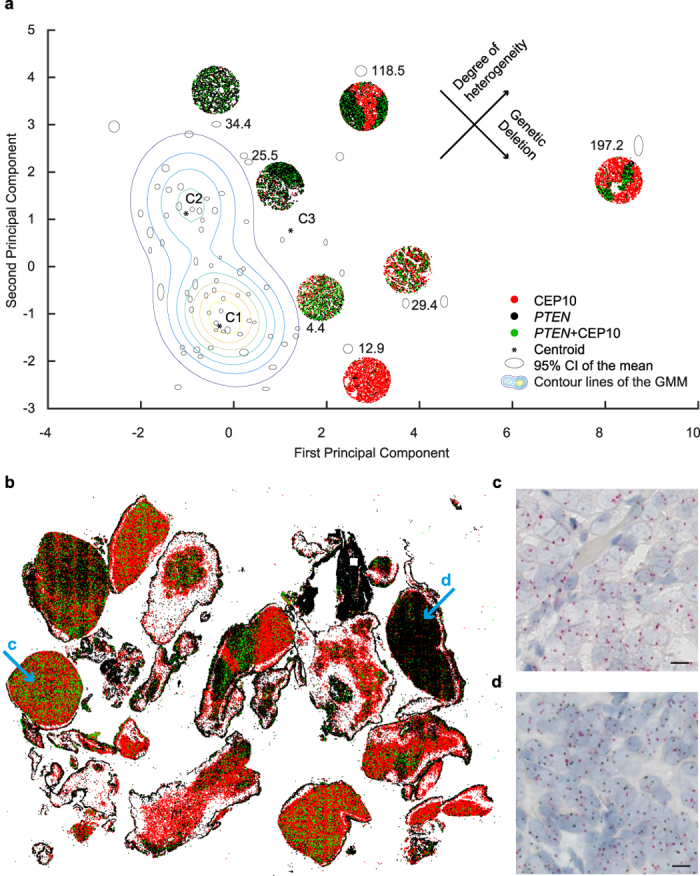
(a) Tissue core distribution in the two-dimensional principal component analysis subspace (n = 71), superimposed with selected signal colour maps shown in Fig. 2. Ellipses refer to individual tissue cores. The axes of the ellipses indicate the 95% CI of an experiment with a total of n = 100 repetitions by varying the number of random points from 201 to 300. The number is the Mahalanobis distance of each point to the respective centroids that are illustrated as stars. (b) A signal colour map generated from a whole slide image of CRPC shows detected and classified PTEN and CEP10 signals. (c,d) Zoomed image of areas marked with arrows in (b). Scale bar, 10 μm.