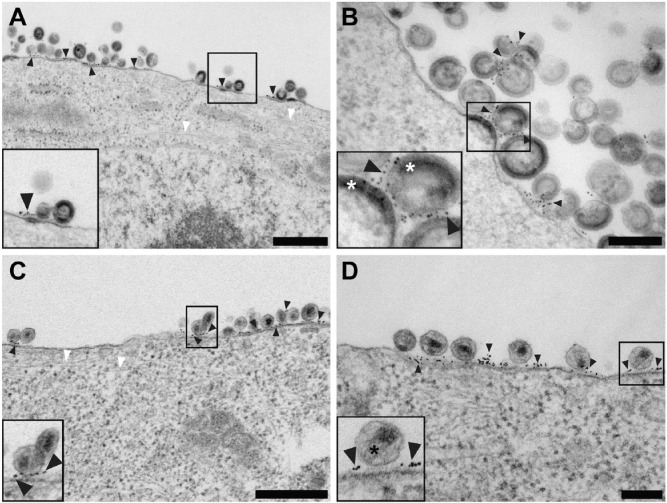
Figure 3.
Conventional transmission electron microscopy of native immunolabeled tetherin on HIV-1 VLPs and HIV-1 virions attached to HT1080 cells. (A and B) Low and high magnification images, respectively, of native immunolabeled tetherin on the plasma membrane of an HT1080 cell and HIV-1 VLPs. Black arrowheads point to immunogold labeling. (A and C) Actin filaments extend through the cell, as indicated by white arrowheads. (C and D) Low and intermediate magnification images, respectively, of native immunolabeled tetherin on the plasma membrane of an HT1080 cell and HIV-1 virions. Black arrowheads point to immunogold labeling. White asterisks are placed over the immature HIV-1 Gag lattice in the inset of panel (B). Black asterisks cover the mature HIV-1 conical core in the inset of panel (D). Insets in (A–D) (black boxes) are 2× magnification. Scale (A, C) 500 nm; (B, D) 200 nm.

