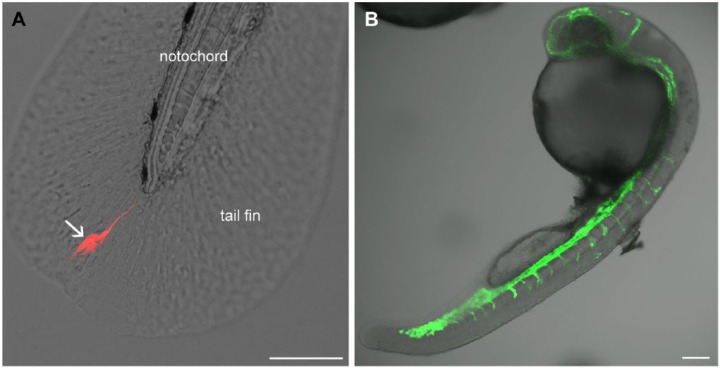
Figure 3.
Fluorescence observation of processes in zebrafish embryos in vivo. (A) A U87 DsRed cell (arrow) invading the tail fin of a zebrafish embryo 2 days after implantation from the spinal cord. (B) Visualization of the vasculature in a living transgenic embryo at 1 day after fertilization (courtesy of Marchien Dallinga). The embryo expresses GFP in the vascular endothelium. Scale, 100 µm.

