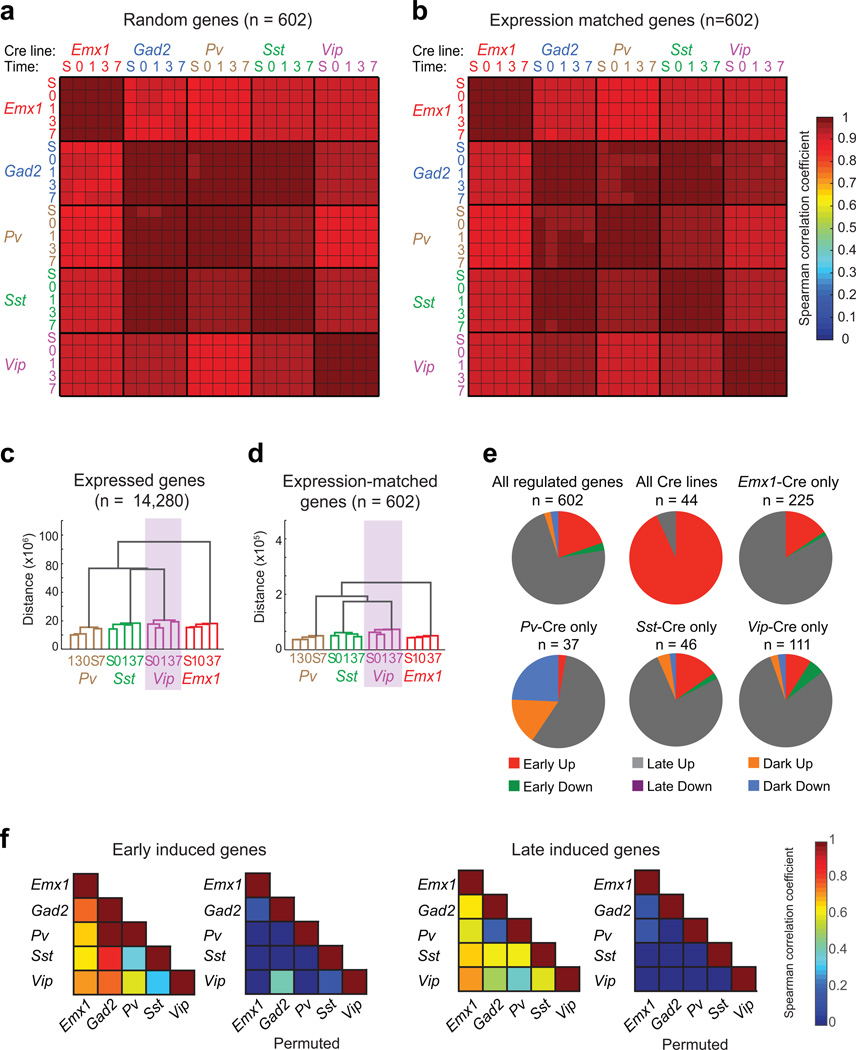
Extended Data Figure 3. Characterization of the experience-induced gene programs in subtypes of cortical neurons.
a) Average matrix of Spearman correlation coefficients computed from the expression values of 1000 random sets of 602 genes (including experience-regulated genes, with replacement).
b) Matrix of the Spearman correlation coefficient computed from the expression levels of control transcripts that match the expression distribution of experience-regulated genes (n = 602).
c) Cladogram resulting from hierarchical clustering of all samples (except samples from Gad2-Cre). Cladograms were computed using the mean expression values (i.e. normalized reads across all exons of a gene) for all expressed transcripts (n = 14,280).
d) Cladogram resulting from hierarchical clustering of the mean expression values of a set of control transcripts that match the expression distribution of experience-regulated genes (n = 602).
e) Pie charts showing the subdivision of experience-regulated genes on the basis of kinetics in each set of Cre lines (red: rapidly induced; gray: induced with delayed kinetics; orange: induced only after two weeks of dark housing; green: rapidly suppressed; magenta: suppressed with delayed kinetics; blue: suppressed only after two weeks of dark housing).
f) Left, matrix of Spearman correlation coefficients between Cre lines computed using the mean expression values (normalized reads across all exons of a gene) of early-induced genes one hour after light exposure. Right, matrix of Spearman correlation coefficients between Cre lines computed using the mean expression values of late-induced genes 7.5 hours after light exposure. For each matrix, the correlations upon permuting the expression values are also shown. (Colorbar at right; scale begins at zero.)

