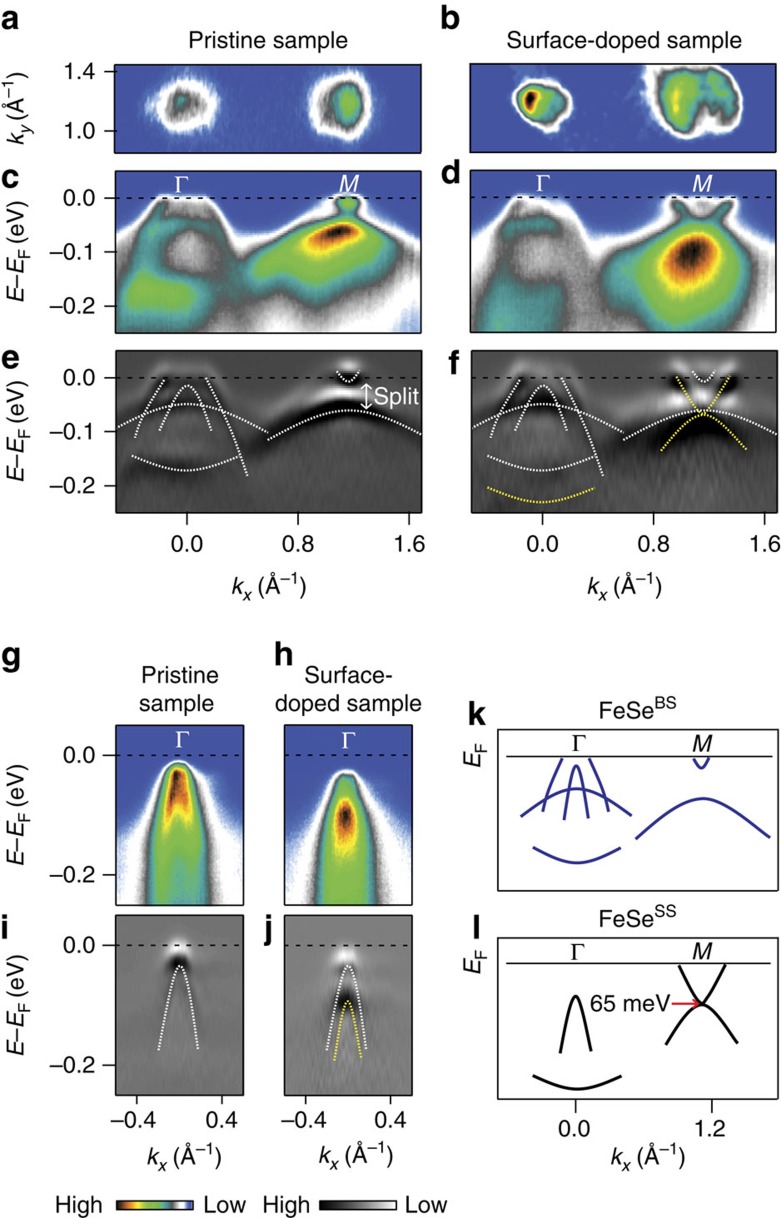
Figure 1. Electronic structures of pristine and surface electron-doped FeSe.
(a) Fermi surface mapping of pristine and (b) surface-doped FeSe, measured at 30 K. (c) Band dispersions along the Γ-M high-symmetry line of pristine and (d) surface-doped FeSe, and (e,f) second derivatives of c and d. White and yellow dashed lines indicate the band dispersions of pristine and surface-doped FeSe, respectively. (g) Band dispersion around the Γ-point in a different geometry for pristine and (h) surface-doped FeSe. (i,j) Second derivatives of g and h. Schematics for the band dispersions of the (k) bulk state (FeSeBS) and (l) doping induced surface state (FeSeSS).

