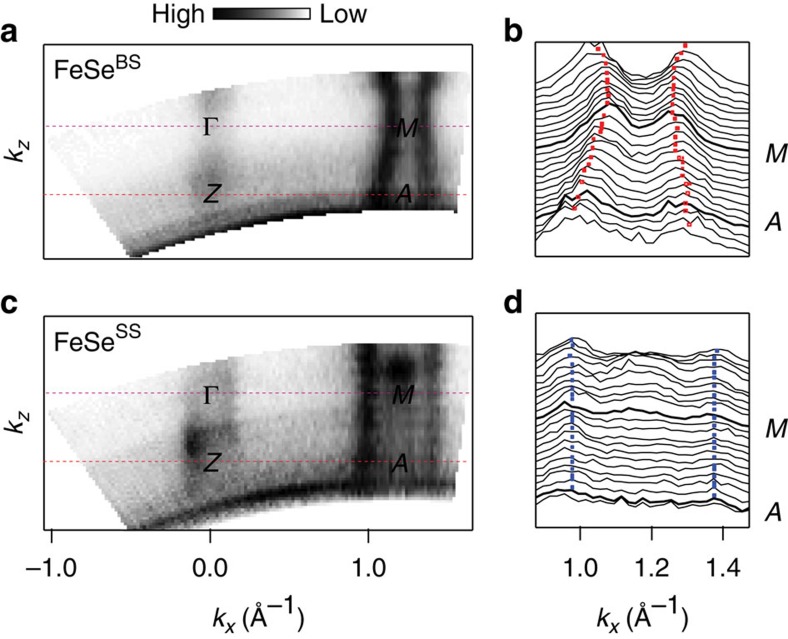
Figure 2. kz dependences of the bulk state and doping induced surface state.
(a) Constant energy map in the kx–kz plane from bulk state (FeSeBS) normal state at 120 K and (b) stacked momentum distribution curves (MDCs) for the electron band. The markers denote local maximum points and represent the band position. (c) kz dependence for surface state (FeSeSS) at 30 K and (d) stacked MDCs for the electron band.

