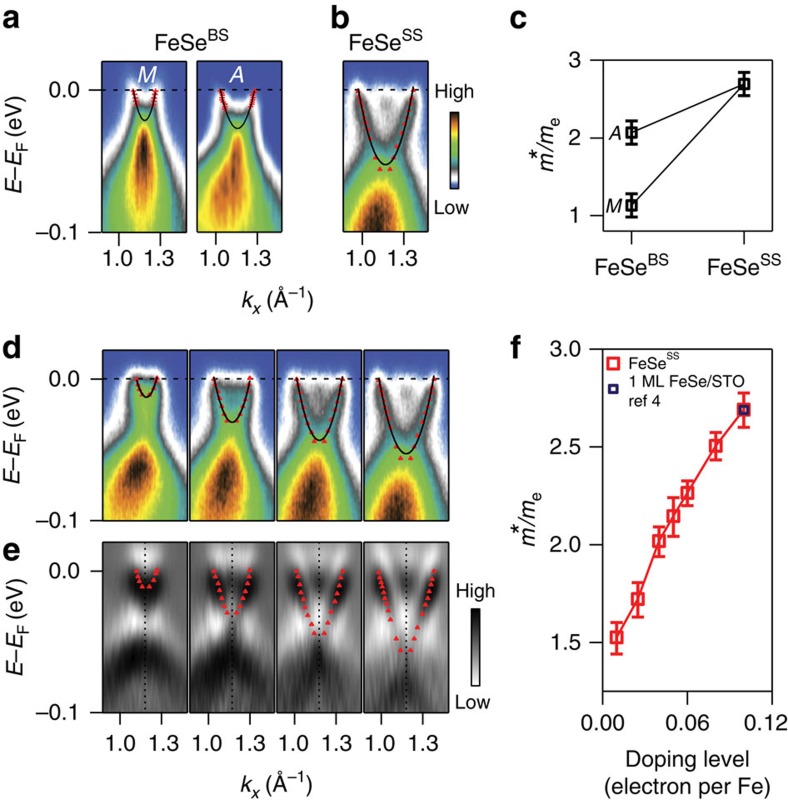
Figure 3. Evolution of the effective mass in FeSeSS.
(a) Electron band near the M-point at kz=0 (π) before surface electron doping. Overlaid on each plot is a parabolic fit used in extracting the effective mass. (b) The same cut after surface electron doping. (c) Effective masses of the FeSeBS and FeSeSS at different kz. (d) Evolution of the electron band with surface electron doping. Parabolic fits of the peak positions (red triangles) are overlaid. (e) Second derivatives of d. Red triangles are peak positions. (f) Evolution of the effective mass from FeSeBS to FeSeSS as a function of surface-doping level. The error bars represent the s.d. of the parabolic fitting.

