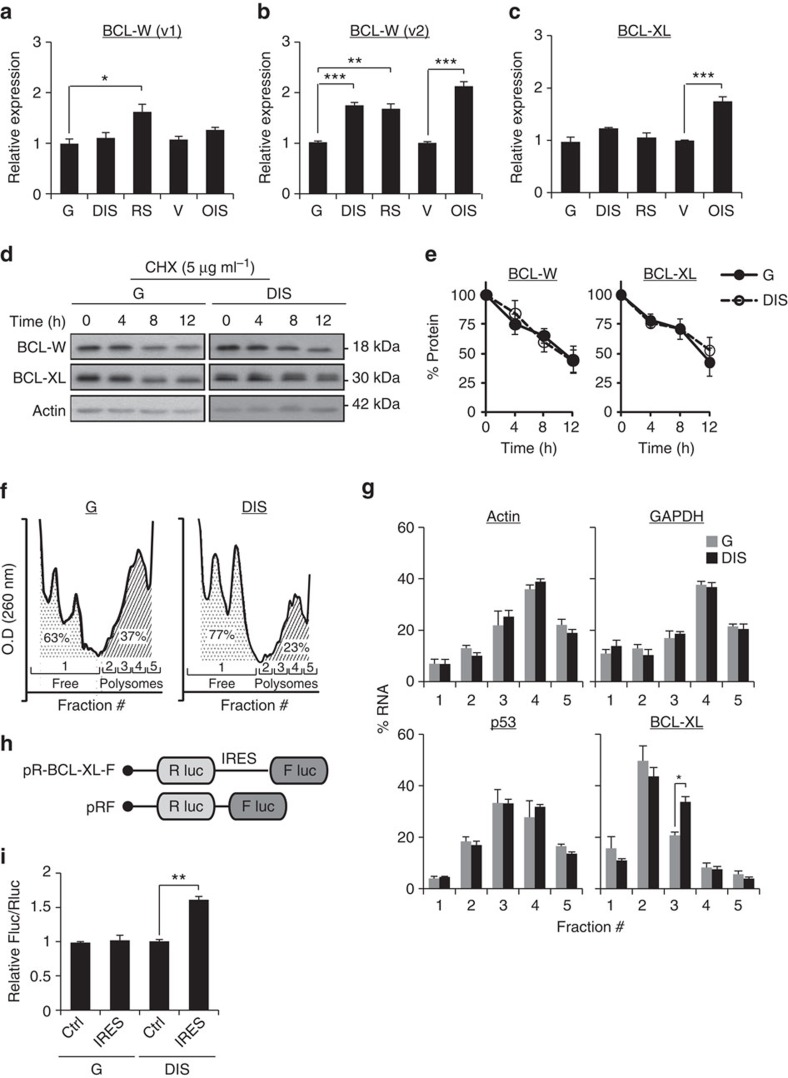
Figure 3. Molecular mechanisms regulating BCL-W and BCL-XL protein level in senescent cells.
(a,b) mRNA expression levels of BCL-W variants 1 and 2 (v1 and v2, respectively) in IMR-90 human fibroblasts (DIS, RS and OIS cells) as well as IMR-90 control (G or V) cells. Data are presented as mean±s.e.m of three repeats. (c) mRNA expression levels of BCL-XL in IMR-90 human fibroblasts (DIS, RS and OIS cells) as well as IMR-90 control (G or V) cells. Data are presented as mean±s.e.m of three repeats. (d) Western blot analysis of BCL-W and BCL-XL following inhibition of protein translation by CHX at the indicated time points after treatment. (e) Quantification of protein levels in d. Data are presented as mean±s.e.m of three independent experiments. (f) Polysomal profiles of control (G) and senescent (DIS) cells after sucrose gradient fractionation. The area under the curve was calculated for monosomes (fraction #1) and polyribosomes (polysomes, fractions 2−5), and indicates a lower polysomal content in DIS cells than in G cells. Data are presented as mean±s.e.m of three independent experiments. (g) Distribution of the mRNAs of GAPDH, Actin, p53 and BCL-XL in ribosomal fractions in senescent (DIS) cells and control (G) cells. The presented changes are relative to total mRNA. Values indicate the average percentage of mRNA in each fraction of total mRNA derived from three independent ribosomal fractionations. (h) Schematic representation of the bicistronic constructs. The BCL-XL construct contains the IRES of 5′-UTR BCL-XL (ref. 33). (i) Relative IRES activity is represented by the Fluc/Rluc ratio for all constructs transfected into IMR-90 cells. Data are presented as mean±s.e.m of three independent experiments. Data were analysed using Student's t-test. *P<0.05. **P<0.005.

