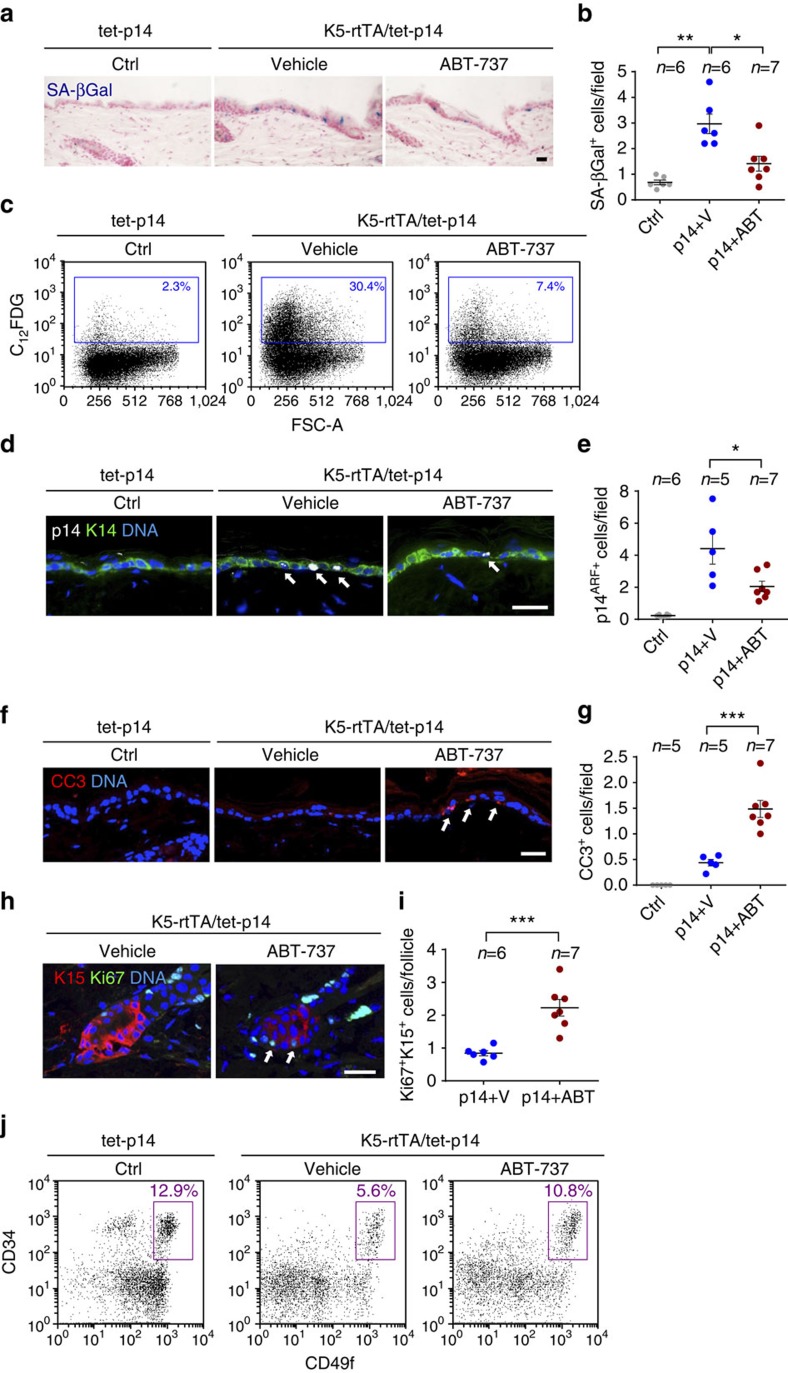
Figure 5. ABT-737 treatment eliminates senescent epidermal cells and induces stem cell proliferation.
(a) Skin sections stained for SA-β-Gal (blue) of control tet-p14 (Ctrl) mice, and K5-rtTA/tet-p14 mice treated with dox for 4 weeks to activate p14ARF, and subsequently treated with ABT-737 (p14+ABT) or vehicle (p14+V) for 4 consecutive days. (b) SA-β-Gal+ cells per microscopic field in mice as in a. (c) FACS analyses of SA-β-Gal activity (C12FDG stain) in epidermal cells isolated from indicated mice. Gate indicates SA-β-Gal+ cell percentages. FSC-A—forward scatter. (d) Skin sections stained for the human p14ARF (white, arrows) from indicated mice after 2 days of ABT-737 or vehicle treatment. K14 (green) marks the basal epidermis. (e) p14ARF+ cells per field in mice as in c. (f) Sections of mice as in c stained for the apoptosis marker cleaved caspase-3 (CC3, arrows). (g) CC3+ cells per field in same mice. (h) Sections of hair follicle bulges of p14-expressing mice after 4 days of ABT-737 or vehicle treatment, stained for the proliferation marker Ki67 (green, arrows) and the bulge marker K15 (red). (i) Numbers of Ki67+K15+ cells per follicle per mouse in mice as in h. Dots represent mean number in individual mice, combining three independent experiments. (j) Representative FACS analyses of epidermal cells from indicated mice after 2 days of ABT-737 or vehicle treatment, stained for CD34, CD49f and Sca1. Charts show only Sca1– (follicular) cells. Gate indicates percentage of CD34+/CD49fhigh hair-follicle stem cells. n=2 mice per group, experiment was done twice. Throughout, dots indicate individual mice, bars indicate mean±s.e.m. Data in b,e,f show mice combined from two independent experiments out of four conducted. *P<0.05; **P<0.005; ***P<0.0005 by Student's t-test. Scale bars, 25 μm.

