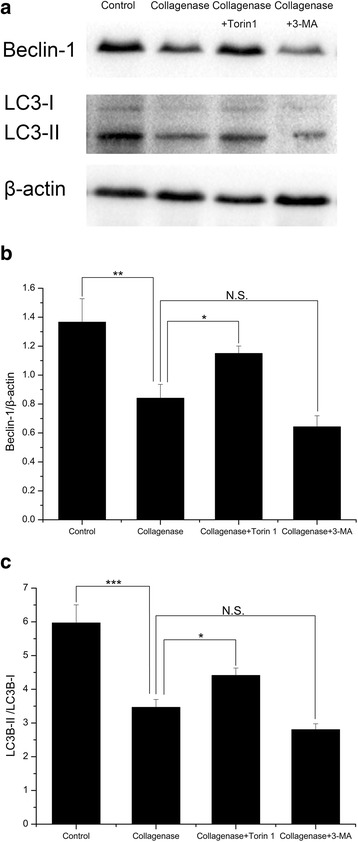
Fig. 5.

The Beclin-1 and LC3 expression in rabbit OA model. a The protein expression of Beclin-1 and LC3 evaluated by western blotting. b, c Quantitative analysis showed a significantly reduction of Beclin-1 expression and the LC3B-II/LC3B-I ratio in the collagenase-injected group compared with the control group. Similarly, expression levels of Beclin-1 and the LC3B-II/LC3B-I ratio were much higher in the Torin 1-treated group than in the collagenase-injected group, while they were lower in the 3-MA-treated group. n = 3 for each group. *P < 0.05, **P < 0.01, ***P < 0.001
