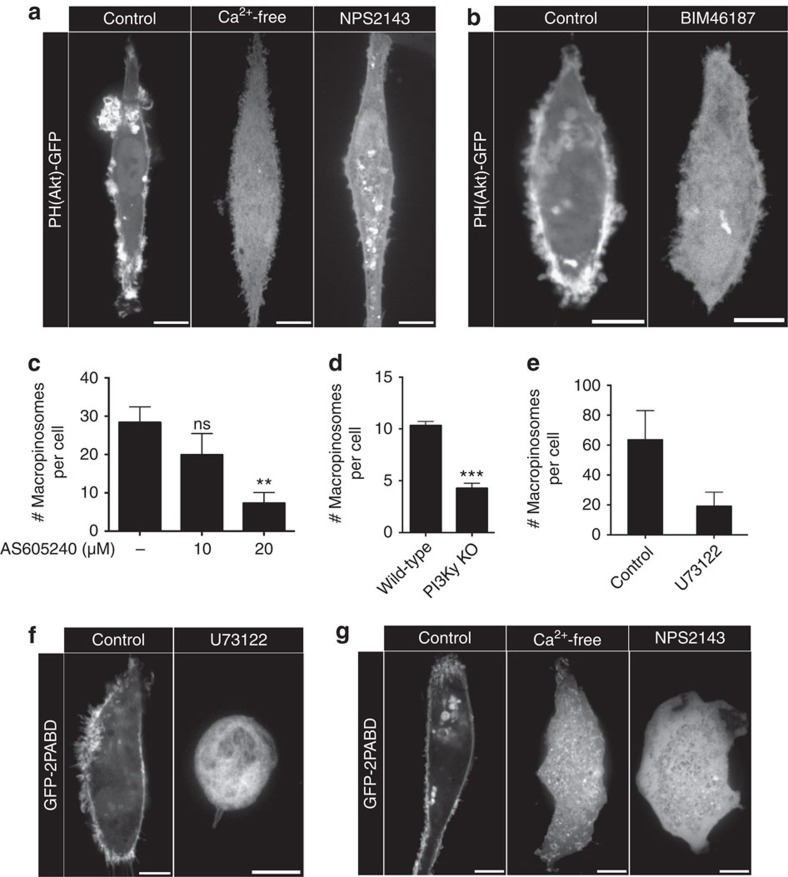
Figure 6. CaSR signals through a Gα-, PtdIns3Kγ- and PLC-dependent pathway.
(a) hMDMs were transfected with the PtdIns(3,4,5)P3 probe (PH)Akt-GFP and imaged live in either calcium-containing or calcium-free medium. Where indicated, the cells were treated with NPS2143 (10 μM) for 1 h before imaging. (b) hMDMs were transfected with (PH)Akt-GFP and imaged live. Where indicated, the cells were treated with BIM46187 (10 μM) for 1 h before imaging. (c) hMDMs were pretreated with the PtdIns3Kγ inhibitor AS605240 at the indicated concentrations for 1 h and then incubated with fluorescent 70 kDa dextran (0.025 mg ml−1) for 15 min at 37 °C. The total number of macropinosomes per cell is plotted. (d) mBMDMs from wild-type and PtdIns3Kγ knockout mice were incubated with fluorescently labelled 70 kDa dextran (0.025 mg ml−1) for 15 min at 37 °C. The total number of macropinosomes per cell is plotted. (e) hMDMs were pretreated with the PLC inhibitor U73122 (1 μM) for 1 h and then incubated with fluorescently labelled 70 kDa dextran (0.025 mg ml−1) for 15 min at 37 °C. The total number of macropinosomes per cell is plotted. (f) hMDMs were transfected with the PtdOH probe GFP-2PABD and were treated with U73122 (1 μM) for 1 h before imaging. (g) hMDMs were transfected with GFP-2PABD and imaged live in either calcium-containing or calcium-free medium. Where indicated, the cells were treated with NPS2143 (10 μM) for 1 h before imaging. Scale bar, 10 μm. **P≤0.01, ***P≤0.001, NS, not significantly different.

