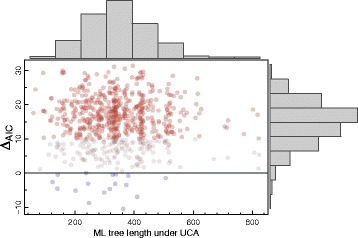
Fig. 1.

Δ A I C values for the simplified version of Koonin & Wolf’s simulations. Positive values for Δ A I C favour UCA, and to ease interpretation the simulations favouring IO are displayed as blue dots, while those strongly favouring UCA (Δ A I C>10) are red. Marginal histograms are also shown, and the grey dots represent simulations favouring UCA only slightly
