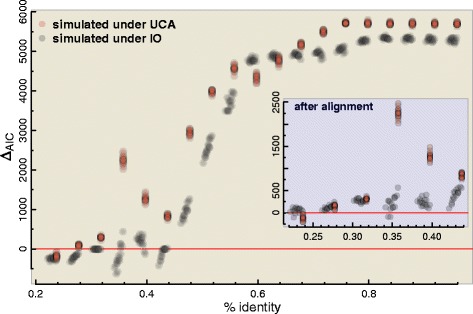
Fig. 2.

UCA test applied over large simulated data sets using a sliding window approach, where data sets’ columns were ordered from lower to higher average identity. Positive values for ΔAIC suggest a UCA. The inset shows AIC after optimizing the alignment within the segments (where the average identity refer to the segment before the alignment step)
