Fig. 2.

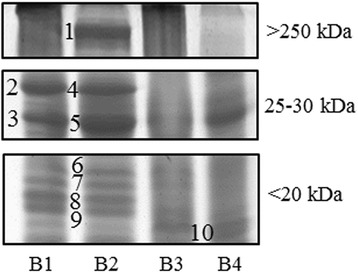
1DE detail of changed protein bands in the different molecular weight regions. Legend. Numbers indicate the protein bands identified by MS/MS analysis

1DE detail of changed protein bands in the different molecular weight regions. Legend. Numbers indicate the protein bands identified by MS/MS analysis