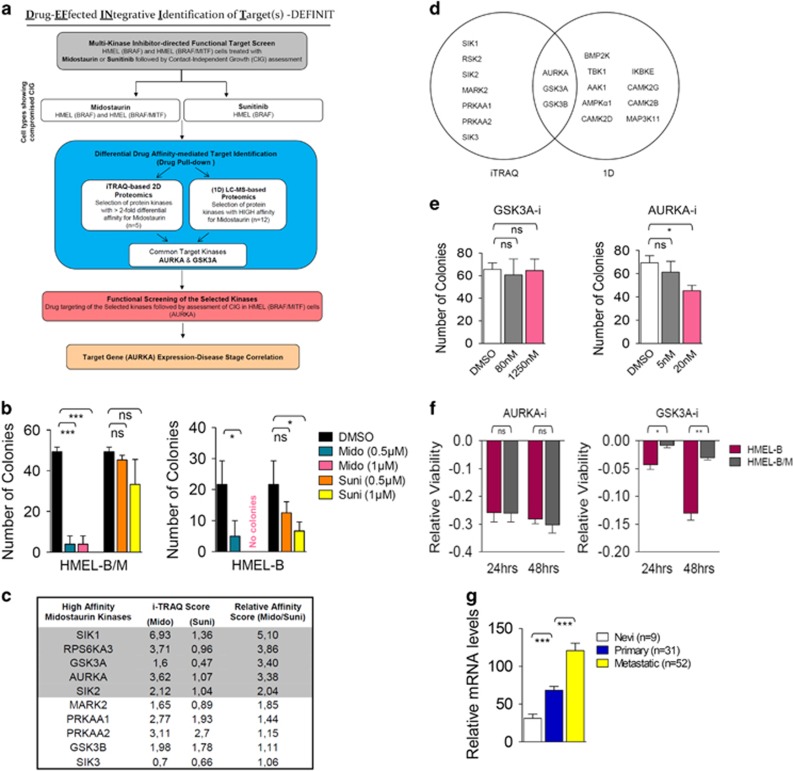
Figure 2.
Integrative differential drug affinity-based proteomics. (a) Flowchart depicting the multi-step strategy (DEFINIT) for the identification of the kinase(s) targets circumventing MITF-mediated intrinsic drug resistance. (b) HMEL-B/M and HMEL-B cells were treated as indicated for 4 weeks in a soft agar colony formation assay followed by colony count (n=3). (c) List of top 10 kinases exhibiting higher relative affinity for midostaurin in comparison to sunitinib based on iTRAQ score. (d) Venn diagram depicting the exclusive and shared kinases from iTRAQ and (1D) LC–MS studies. (e) HMEL-B/M cells were treated as indicated for 4 weeks in a soft agar colony formation assay followed by colony count (n=3). (f) HMEL-B and HMEL-B/M cells were treated with DMSO control or AURKA inhibitor (MLN8237, 100 nM) and GSK3A inhibitor (SB415286, 5 μM) for 24 or 48 h followed by assessment of relative viability (n=3). (g) Relative gene expression levels of AURKA in the indicated stages of melanoma. All error bars indicate ±S.D.; ns, non-significant; *P⩽0.05, **P⩽0.01, ***P⩽0.001

