Figure 1.
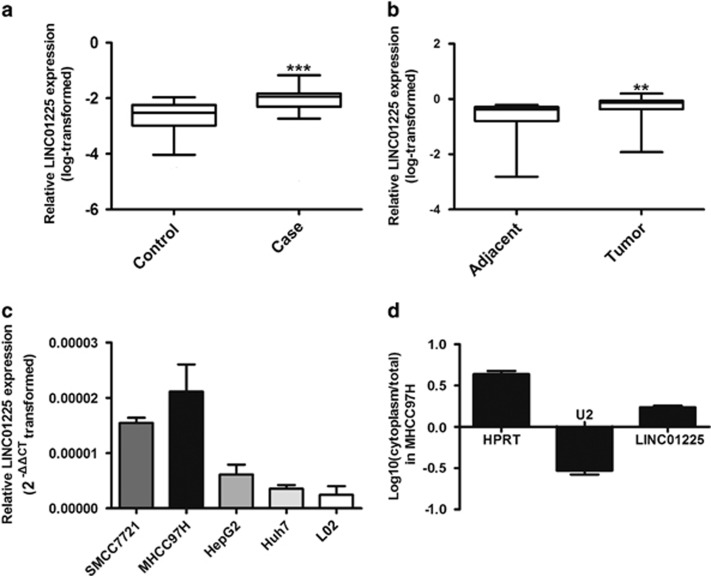
Aberrant upregulation of LINC01225 in HCC; subcellular location. (a) Increased level of LINC01225 in HCC serum (n=66) was detected in comparison with serum from healthy controls (n=70). The relative expression of LINC01225 versus Has-5s, calculated by 2−△△CT, was log transformed and presented as box plots. Box plot explanation: upper horizontal line of box, 75th percentile; lower horizontal line of box, 25th percentile; horizontal bar within box, median; upper horizontal bar outside box, 95th percentile; lower horizontal bar outside box, 5th percentile. (b) Increased level of LINC01225 was detected in HCC tissues compared with the corresponding adjacent tissues (n=180). The relative expression of LINC01225 versus Has-5 s, calculated by 2−△△CT, was log transformed and presented as box plots. Box plot explanation: upper horizontal line of box, 75th percentile; lower horizontal line of box, 25th percentile; horizontal bar within box, median; upper horizontal bar outside box, 95th percentile; lower horizontal bar outside box, 5th percentile. (c) Level of LINC01225 was detected in HCC cell lines and L02 cells. Data were 2△△CT transformed and presented as mean±S.E.M. (d) Subcellular localization indicated that the transcript for LINC01225 was located primarily in the cytoplasm of MHCC97H cells, according to quantitative real-time PCR amplification with separated cytoplasmic and nuclear RNA. U2 was used as the control for cytonuclear expression and HPRT for cytoplasmic expression. Data were log transformed and presented as mean±S.E.M. Human Has-5 s was used as control. (**P<0.01, ***P<0.001)

