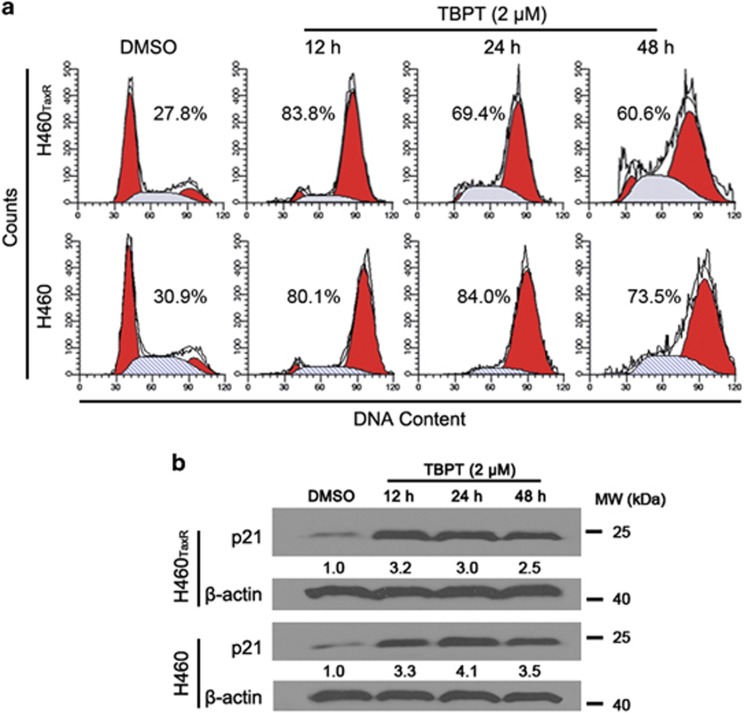
Figure 6.
Analyses of the cell cycle and p21 expression in H460TaxR and H460 cells after TBPT treatment. NSCLC cells were treated with DMSO or TBPT (2 μM) for the indicated times. (a) Cells were stained with PI and analyzed via flow cytometry. The two red peaks indicate the cells in the G1 and G2/M phases, respectively. The middle gray area indicates the cells in the S phase of the cell cycle. The ratio of cells in the G2/M phase is also shown. (b) Western blot analysis of p21 expression in NSCLC cells

