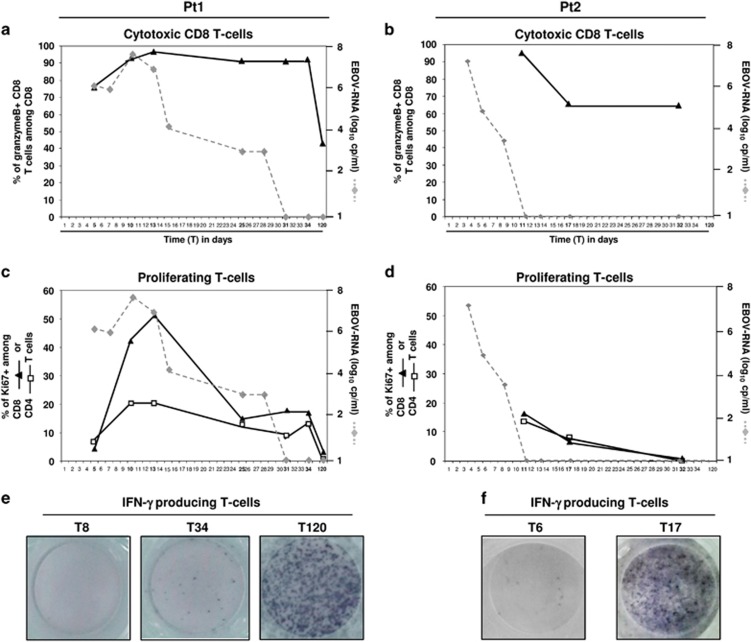
Figure 3.
Time course of cytotoxic, proliferating and IFNγ-producing T-cells. The kinetics of Granzyme (a and b) and Ki67 (c and d) expression on CD8 (black triangles) or CD4 (white squares) T-cells are analyzed by intracellular staining and flow cytometry. The kinetics of viral load is reported (gray dotted line). The Elispot images showing the IFN-γ production after PHA stimulation at different time point (T8, T34 and T120 for ot1 and T6, T17 for pt2) are reported (e and f)

