Fig. 3.—
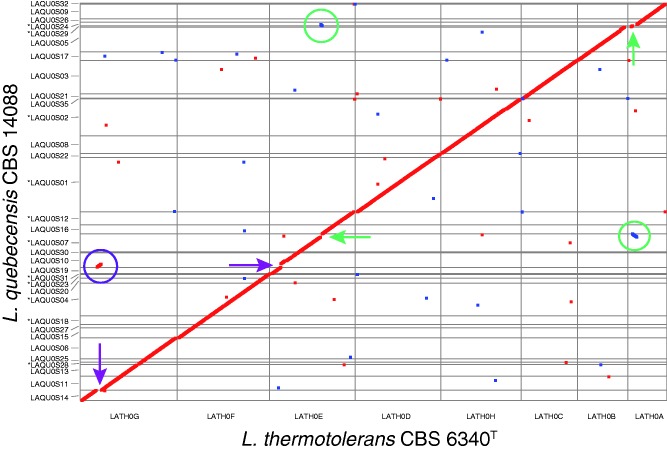
Whole-genome dot-plot comparison between Lachancea quebecensis CBS 14088 and Lachancea thermotolerans CBS 6340T. Only scaffolds with at least five orthologous gene pairs were considered. The six-frame translations of both genomes were compared via MUMmer 3.0. Homologous regions are plotted as squares, which are color coded according to their relative orientation: Red for parallel orientation and blue for antiparallel orientation. Synteny breakpoints and chromosomal rearrangements are highlighted with circles and arrows, respectively. The green circles indicate the reciprocal translocation that occurred in L. quebecensis between homologs of KLTH0A01804g and KLTH0A01826g, as well as KLTH0E10010g and KLTH0E10054g. The purple circle highlights the third major synteny breakpoint, which involved the homologous regions KLTH0G04730g–KLTH0G04752g and KLTH0E02200g–KLTH0E02310g. (*) indicate that the scaffolds were reverse complemented, gene order is well conserved however the strand sequence was inverted.

