Figure 2.
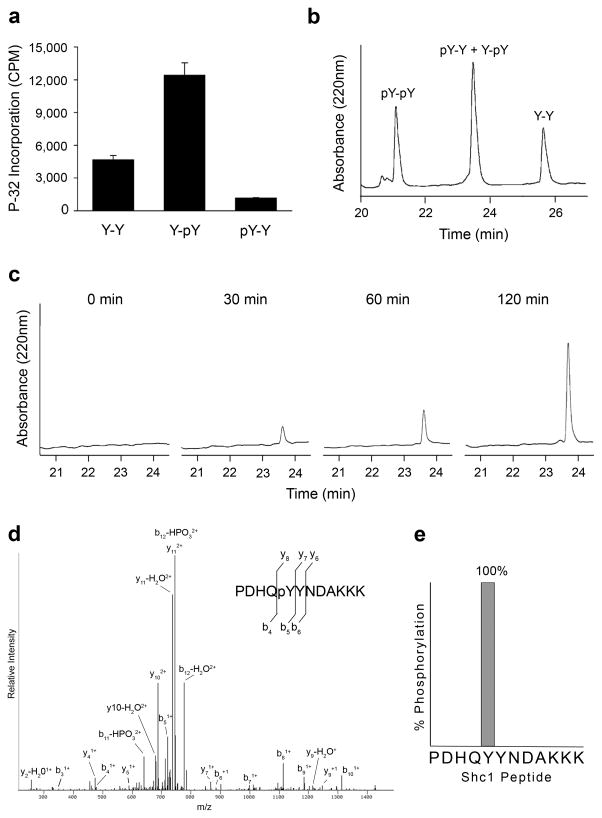
Shc1 is phosphorylated by EGFR at Tyr239. (a) EGFR kinase assays with synthetic peptides corresponding to the sequence surrounding Tyr239 of Shc1 (PDHQYYNDAKKK = Y-Y; PDHQYpYNDAKKK = Y-pY; PDHQpYYNDAKKK = pY-Y). Error bars, s.d. (n=3 technical replicates) (b) Reversed-phase HPLC separation of Shc1 peptide standards (PDHQpYpYNDAKKK = pY-pY). The retention times of each peptide were established by individual injections (data not shown). (c) HPLC analysis of an EGFR kinase assay with the Shc1 Y-Y peptide at multiple time points. (d) Mass spectrometry based analysis of the 120 min peak in panel C. The LC-MS/MS spectrum for the singly phosphorylated peptide PDHQpYYNDAKKK is shown. (e) Percentage of peptide spectra detected by mass spectrometry phosphorylated at Tyr239 or Tyr240.

