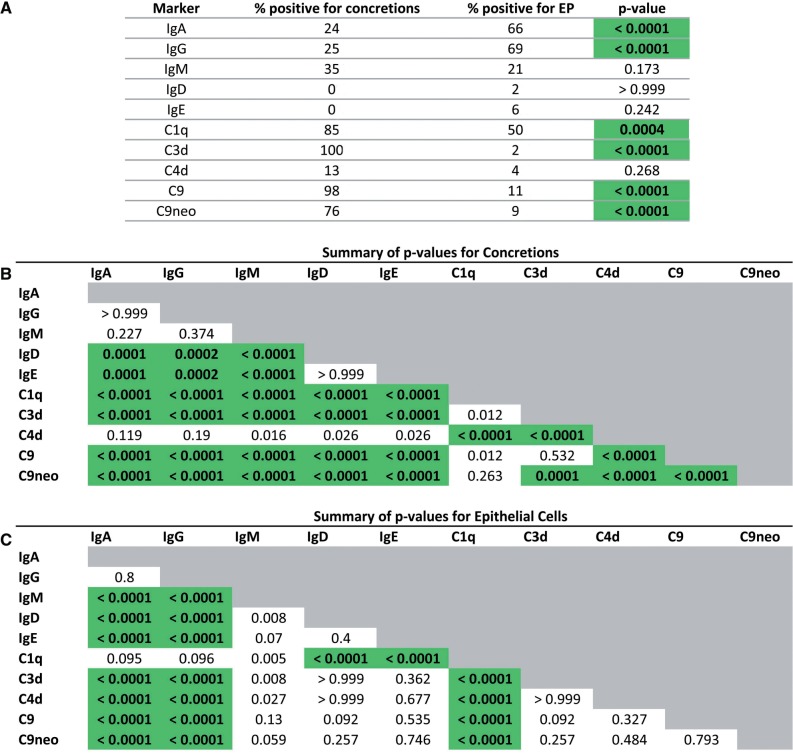
FIGURE 5.
Choroid plexus concretion and epithelial cell (EP) staining. Significant differences are highlighted in green. Any statistically significant comparisons for C4d, IgD, and IgE are attributable to the rarity of staining of these compared with the other complement components and immunoglobulins. (A) Concretion staining was observed more often than EP staining for C1q, C3d, C9, and C9neo. The reverse was true for IgA and IgG. There was no significant difference in the frequency between concretion and EP staining for IgM. (B) There were significant differences in staining frequencies of concretions (more frequent, see Tables 3 and 4) for C1q, C3d, C9, and C9neo than for IgA, IgG, and IgM. (C) There were significant differences in staining frequency of epithelial cells for IgG and IgA (more frequent, see Tables 3 and 4) than for IgM C3d, C9, and C9 neo. Two-tailed Fisher exact test, Bonferroni correction for multiple comparisons (SPSS Statistics 17.0).

