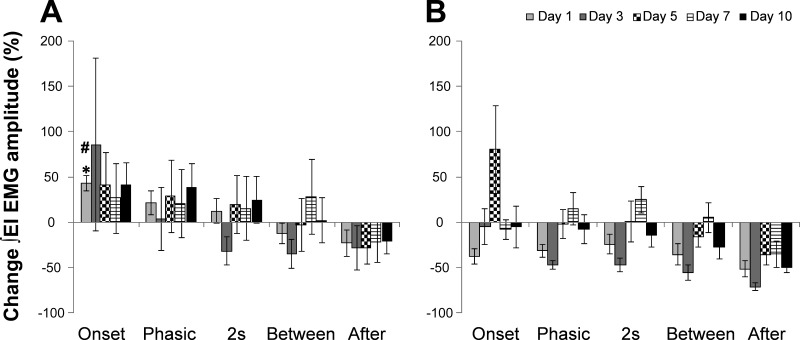
Fig. 5.
Percent change in ∫EI EMG amplitude on days 1, 3, 5, 7, and 10 normalized to ITTO day 1 Before values. A: High-responder animals had an increase in ∫EI EMG amplitude (%) during Onset on ITTO day 1. B: Low responder animals had a decrease in ∫EI EMG amplitude (%) during Onset on ITTO day 1. *P ≤ 0.05 for Onset compared with After on ITTO day 1, and #P ≤0.001 for Onset response in High vs. Low responders on ITTO day 1.

