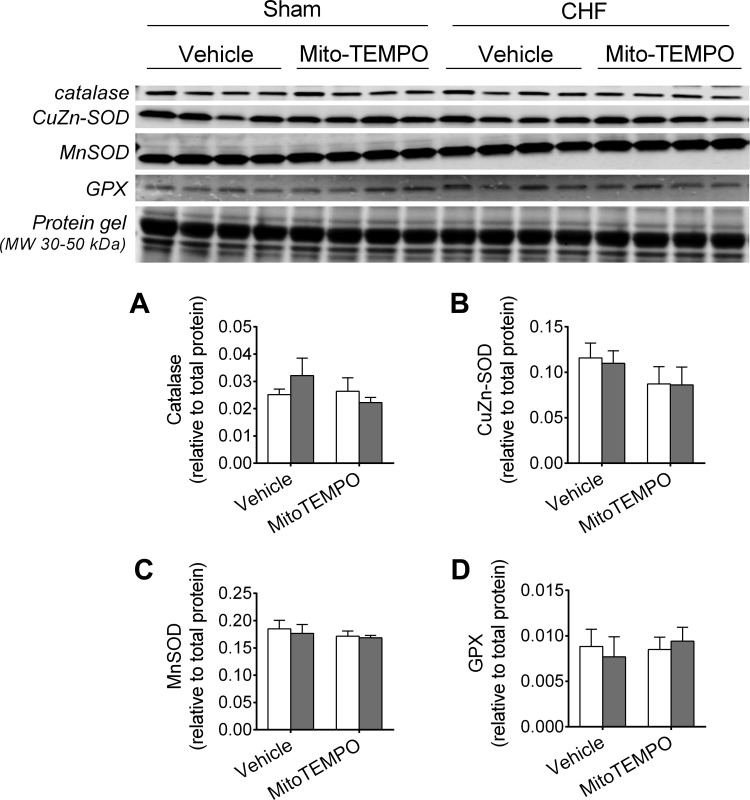
Fig. 3.
Protein levels of antioxidant enzymes. SOD, superoxide dismutase; GPX, glutathione peroxidase. Protein levels were determined by Western blots (sample images shown in rows 1–4) and normalized to total protein loaded onto gel (sample image shown in row 5). Sham and CHF are shown as in Fig. 1.

