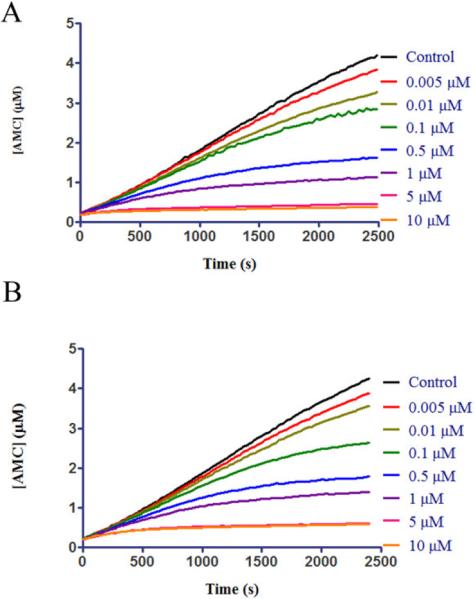
Figure 5.
Representative progress curves of cathepsin L (1 nM) activity using Z-FR-AMC (10 μM) as substrate and increasing concentrations of (A) inhibitor 1 and (B) inhibitor 32 (0–10 μM). Reactions were initiated by the addition of enzyme with no pre-incubation with compounds. Release of the fluorescent product AMC was followed as a function of time.

