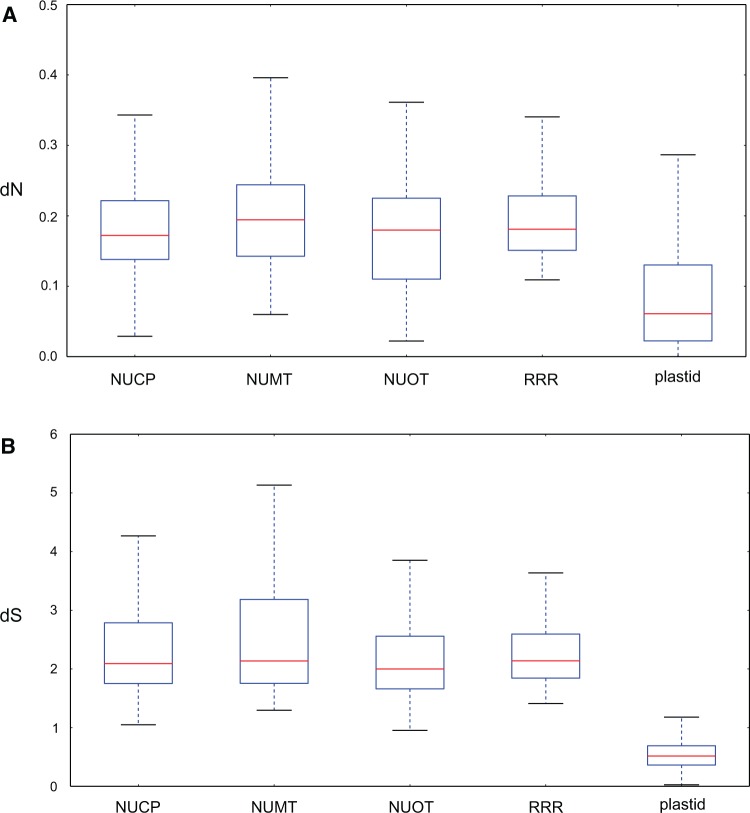
Fig. 1.—
Evolutionary rates of DNA-RRR, nuclear control, and plastid-encoded genes. (A) Nonsynonymous (dN) and (B) synonymous (dS) substitution rates of different gene groups are shown. NUCP, nuclear encoded plastid targeted control genes; NUMT, nuclear encoded mitochondrial targeted control genes; NUOT, other nuclear encoded control genes; RRR, plastid-targeted DNA replication, recombination and repair genes; plastid, plastid-encoded genes. Boxes represent sorted rates ranging from 25% to 75%, dashed lines extend to maximal and minimal rates, red lines represent the median rate for each gene group.

