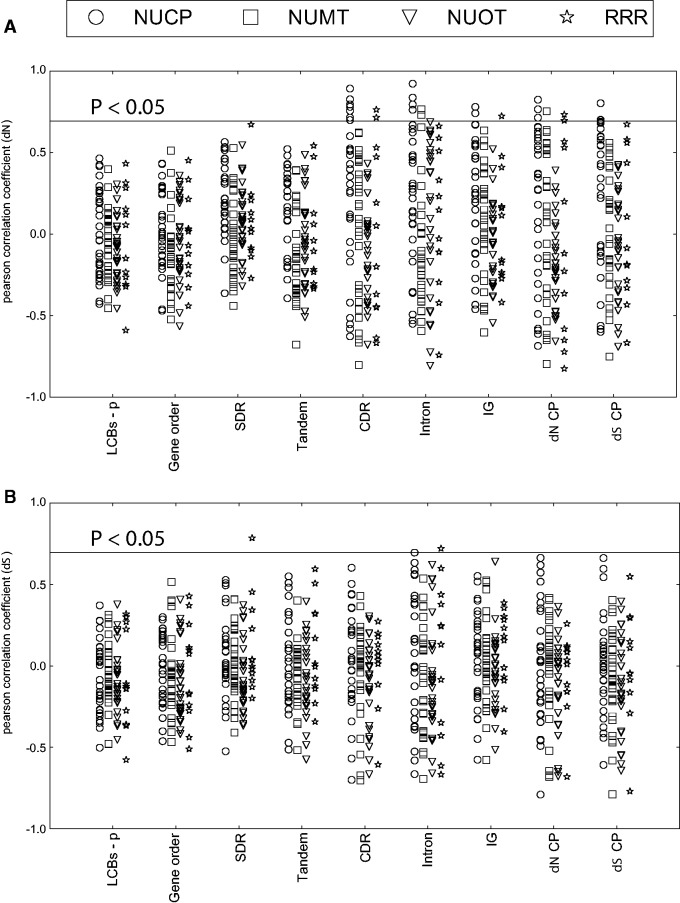
Fig. 2.—
Pearson correlation coefficient between gene evolutionary rates and genome complexity. Correlations of (A) nonsynonymous (dN) and (B) synonymous (dS) substitution rates of genes and genome complexity are shown. NUCP, nuclear encoded plastid targeted control genes; NUMT, nuclear encoded mitochondrial targeted control genes; NUOT, other nuclear encoded control genes; RRR, plastid-targeted DNA replication, recombination and repair genes; LCBs-p, inversion distance estimated from local collinear blocks; Gene order, inversion distance estimated from gene order; SDR, small dispersal repeats; Tandem, repeats estimated from Tandem Repeat Finder (Benson 1999); CDR, indels in coding and rRNA regions; Intron, indels in intron regions; IG, indels in intergenic regions; dN CP, nonsynonymous substitution rates of the plastid genome; dS CP, synonymous substitution rates of the plastid genome.

